
- Startseite >
- Flüsse >
- Wasserstand >
- Bayern >
- Rappoldshofen >
- Jahresgrafik

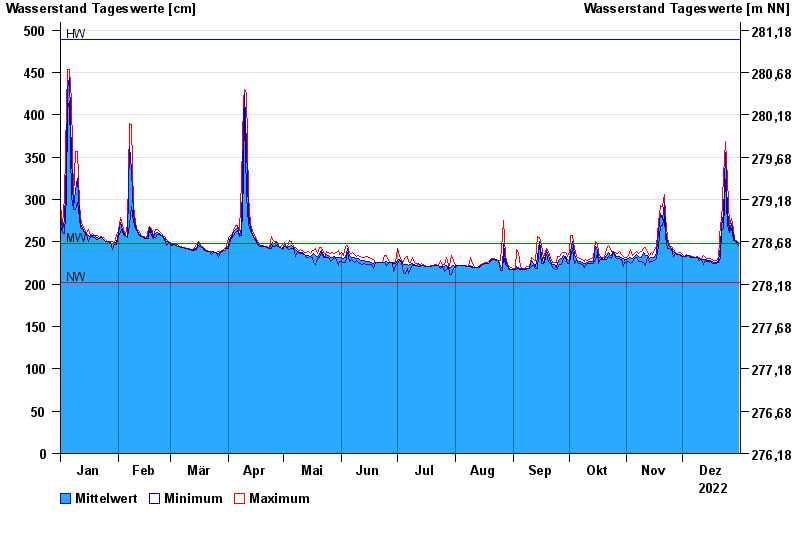
Jahresgrafik Rappoldshofen / Aisch
Wasserstand vom 01.01.2022 bis zum 31.12.2022
| Datum | Mittelwert [cm] | Maximum [cm] | Minimum [cm] |
|---|---|---|---|
| 31.12.2022 | 248 | 249 | 246 |
| 30.12.2022 | 250 | 252 | 249 |
| 29.12.2022 | 252 | 253 | 252 |
| 28.12.2022 | 259 | 266 | 252 |
| 27.12.2022 | 272 | 277 | 266 |
| 26.12.2022 | 263 | 269 | 261 |
| 25.12.2022 | 286 | 324 | 269 |
© Bayerisches Landesamt für Umwelt 2025