
- Startseite >
- Flüsse >
- Wasserstand >
- Bayern >
- Rosenheim >
- Jahresgrafik

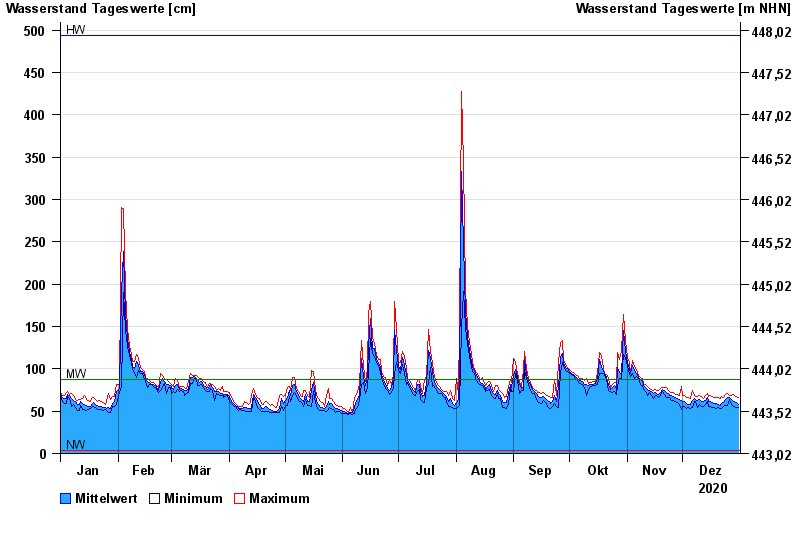
Jahresgrafik Rosenheim / Mangfall
Wasserstand vom 01.01.2020 bis zum 31.12.2020
| Datum | Mittelwert [cm] | Maximum [cm] | Minimum [cm] |
|---|---|---|---|
| 31.12.2020 | 58 | 66 | 54 |
| 30.12.2020 | 60 | 67 | 54 |
| 29.12.2020 | 62 | 68 | 56 |
| 28.12.2020 | 62 | 70 | 56 |
| 27.12.2020 | 64 | 69 | 58 |
| 26.12.2020 | 66 | 68 | 64 |
| 25.12.2020 | 66 | 71 | 57 |
© Bayerisches Landesamt für Umwelt 2025