
- Startseite >
- Flüsse >
- Wasserstand >
- Bayern >
- Schmidmühlen >
- Jahresgrafik

Jahresgrafik Schmidmühlen / Vils
Wasserstand vom 01.01.2020 bis zum 31.12.2020
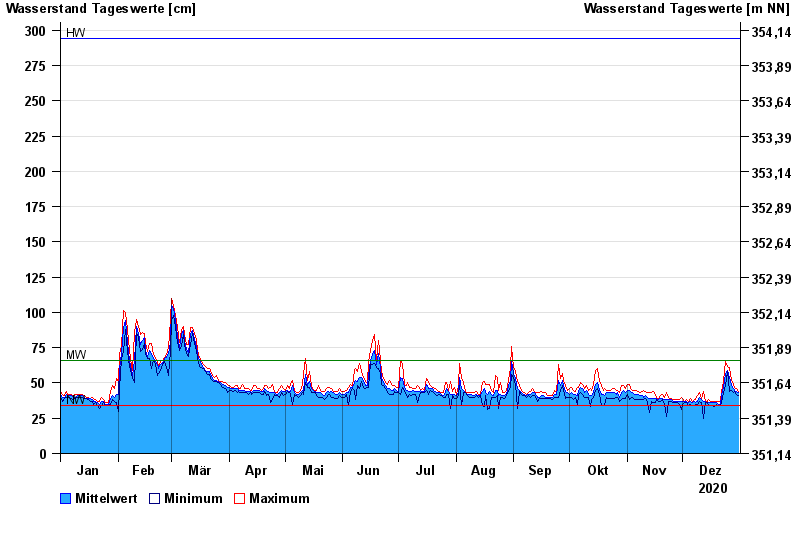
| Datum | Mittelwert [cm] | Maximum [cm] | Minimum [cm] |
|---|---|---|---|
| 31.12.2020 | 43 | 44 | 41 |
| 30.12.2020 | 44 | 46 | 42 |
| 29.12.2020 | 45 | 47 | 44 |
| 28.12.2020 | 46 | 49 | 43 |
| 27.12.2020 | 48 | 52 | 45 |
| 26.12.2020 | 54 | 61 | 44 |
| 25.12.2020 | 59 | 62 | 58 |
© Bayerisches Landesamt für Umwelt 2025