
- Startseite >
- Flüsse >
- Wasserstand >
- Bayern >
- Staudach >
- Jahresgrafik

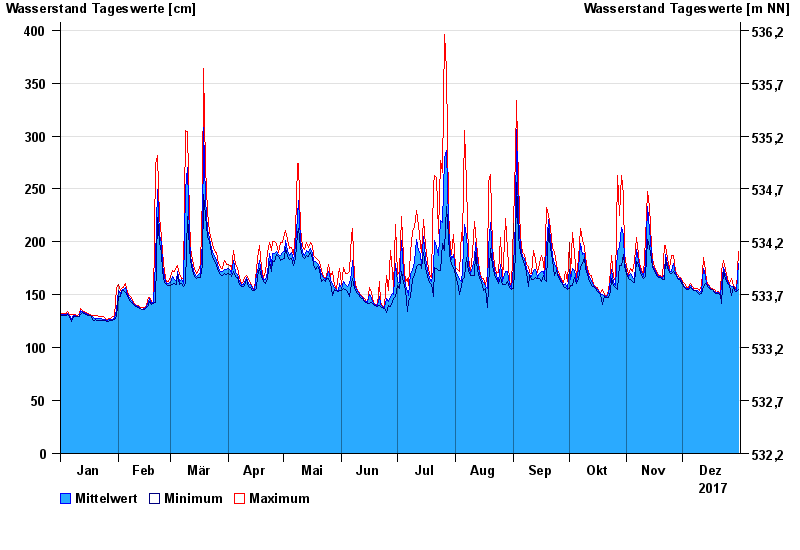
Jahresgrafik Staudach / Tiroler Achen
Wasserstand vom 01.01.2017 bis zum 31.12.2017
| Datum | Mittelwert [cm] | Maximum [cm] | Minimum [cm] |
|---|---|---|---|
| 31.12.2017 | 180 | 191 | 155 |
| 30.12.2017 | 154 | 155 | 153 |
| 29.12.2017 | 156 | 158 | 154 |
| 28.12.2017 | 158 | 159 | 158 |
| 27.12.2017 | 158 | 165 | 149 |
| 26.12.2017 | 160 | 161 | 159 |
| 25.12.2017 | 163 | 165 | 161 |
© Bayerisches Landesamt für Umwelt 2025