
- Startseite >
- Flüsse >
- Wasserstand >
- Bayern >
- Treuchtlingen >
- Jahresgrafik

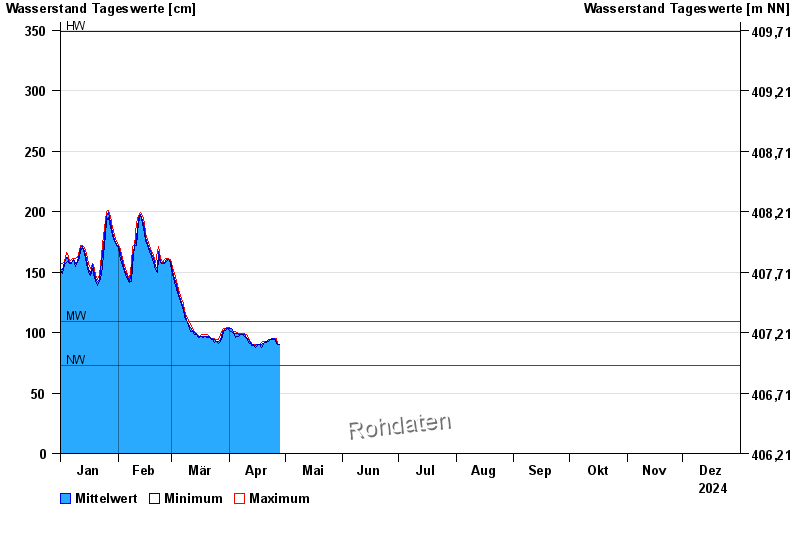
Jahresgrafik Treuchtlingen / Altmühl
Wasserstand vom 01.01.2024 bis zum 31.12.2024
| Datum | Mittelwert [cm] | Maximum [cm] | Minimum [cm] |
|---|---|---|---|
| 22.11.2024 | 112 | 114 | 112 |
| 21.11.2024 | 109 | 112 | 107 |
| 20.11.2024 | 104 | 115 | 90 |
| 19.11.2024 | 88 | 91 | 87 |
| 18.11.2024 | 87 | 88 | 87 |
| 17.11.2024 | 88 | 89 | 87 |
| 16.11.2024 | 87 | 88 | 87 |
© Bayerisches Landesamt für Umwelt 2024