
- Startseite >
- Flüsse >
- Wasserstand >
- Bayern >
- Trunstadt >
- Jahresgrafik

Jahresgrafik Trunstadt / Main
Wasserstand vom 01.01.2022 bis zum 31.12.2022
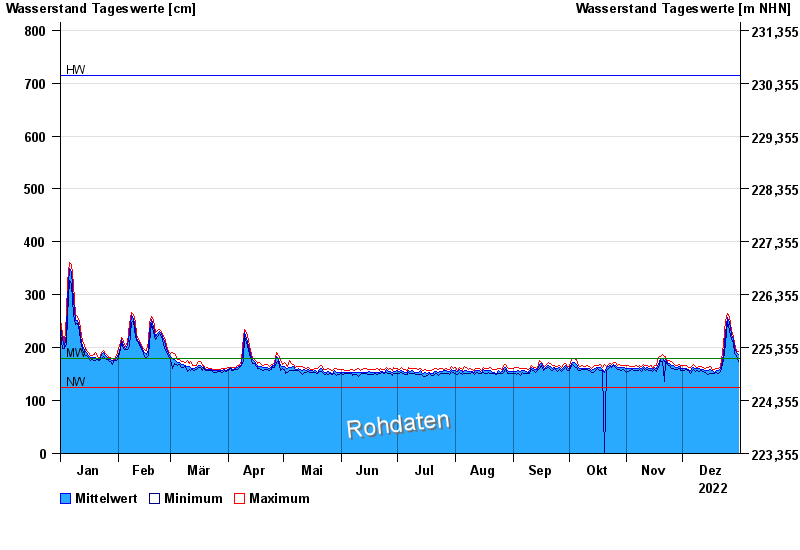
| Datum | Mittelwert [cm] | Maximum [cm] | Minimum [cm] |
|---|---|---|---|
| 31.12.2022 | 187 | 193 | 184 |
| 30.12.2022 | 190 | 194 | 186 |
| 29.12.2022 | 200 | 207 | 189 |
| 28.12.2022 | 216 | 221 | 207 |
| 27.12.2022 | 223 | 233 | 215 |
| 26.12.2022 | 247 | 258 | 233 |
| 25.12.2022 | 257 | 264 | 250 |
© Bayerisches Landesamt für Umwelt 2025