
- Startseite >
- Flüsse >
- Wasserstand >
- Bayern >
- Unterköblitz >
- Jahresgrafik

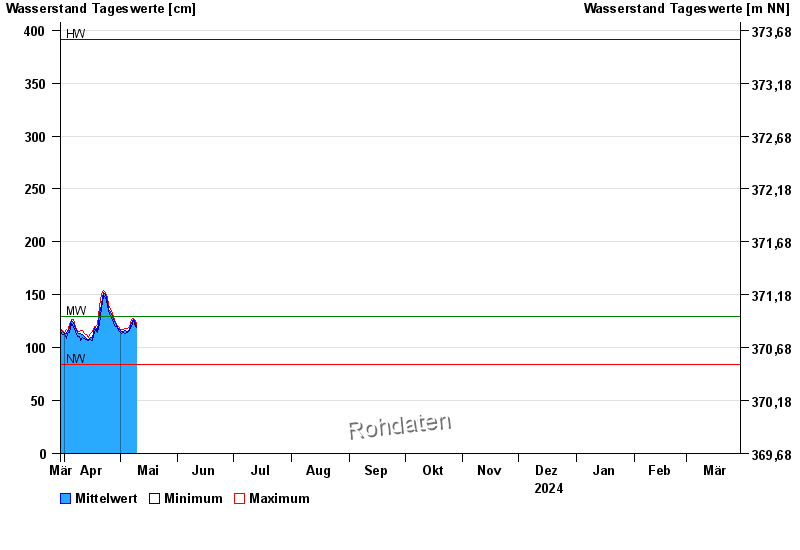
Jahresgrafik Unterköblitz / Naab
Wasserstand vom 30.03.2024 bis zum 29.03.2025
| Datum | Mittelwert [cm] | Maximum [cm] | Minimum [cm] |
|---|---|---|---|
| 09.08.2024 | 121 | 127 | 117 |
| 08.08.2024 | 123 | 125 | 118 |
| 07.08.2024 | 126 | 131 | 125 |
| 06.08.2024 | 136 | 142 | 131 |
| 05.08.2024 | 145 | 147 | 142 |
| 04.08.2024 | 134 | 145 | 129 |
| 03.08.2024 | 134 | 140 | 131 |
© Bayerisches Landesamt für Umwelt 2024