
- Startseite >
- Flüsse >
- Wasserstand >
- Bayern >
- Untersteinach >
- Jahresgrafik

Jahresgrafik Untersteinach / Warme Steinach
Wasserstand vom 01.01.2019 bis zum 31.12.2019
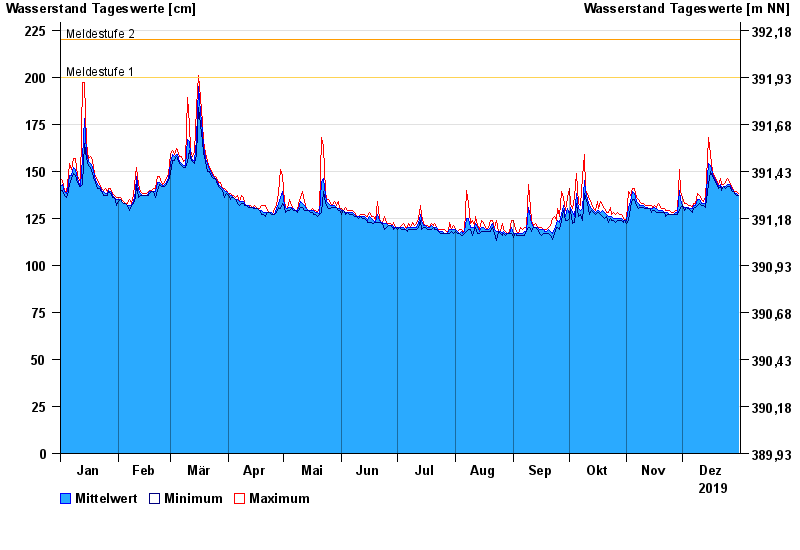
- Meldestufe 1 200 cm
- Meldestufe 2 220 cm
- Meldestufe 3 250 cm
| Datum | Mittelwert [cm] | Maximum [cm] | Minimum [cm] |
|---|---|---|---|
| 31.12.2019 | 137 | 138 | 137 |
| 30.12.2019 | 138 | 139 | 137 |
| 29.12.2019 | 138 | 139 | 138 |
| 28.12.2019 | 140 | 140 | 139 |
| 27.12.2019 | 141 | 142 | 140 |
| 26.12.2019 | 143 | 144 | 142 |
| 25.12.2019 | 143 | 146 | 142 |
© Bayerisches Landesamt für Umwelt 2025