
- Startseite >
- Flüsse >
- Wasserstand >
- Bayern >
- Viechtach Reibenmühle >
- Jahresgrafik

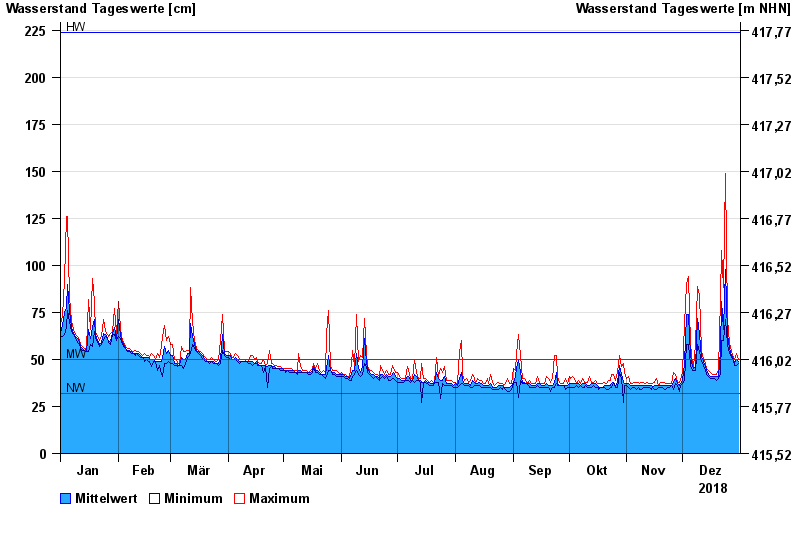
Jahresgrafik Viechtach Reibenmühle / Aitnach
Wasserstand vom 01.01.2018 bis zum 31.12.2018
| Datum | Mittelwert [cm] | Maximum [cm] | Minimum [cm] |
|---|---|---|---|
| 31.12.2018 | 49 | 50 | 48 |
| 30.12.2018 | 50 | 53 | 47 |
| 29.12.2018 | 48 | 50 | 47 |
| 28.12.2018 | 50 | 51 | 49 |
| 27.12.2018 | 52 | 54 | 51 |
| 26.12.2018 | 56 | 59 | 53 |
| 25.12.2018 | 63 | 71 | 58 |
© Bayerisches Landesamt für Umwelt 2025