
- Startseite >
- Flüsse >
- Wasserstand >
- Bayern >
- Weißenburg >
- Jahresgrafik

Jahresgrafik Weißenburg / Schwäbische Rezat
Wasserstand vom 01.01.2021 bis zum 31.12.2021
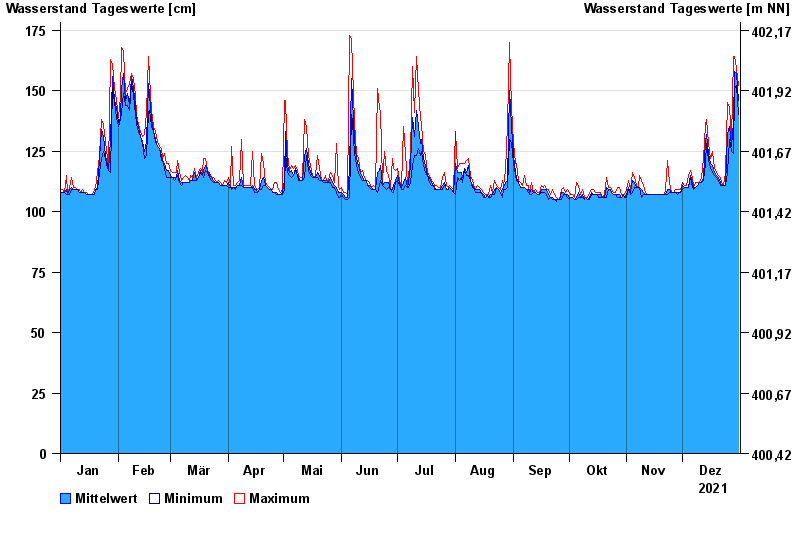
| Datum | Mittelwert [cm] | Maximum [cm] | Minimum [cm] |
|---|---|---|---|
| 31.12.2021 | 146 | 152 | 140 |
| 30.12.2021 | 157 | 159 | 152 |
| 29.12.2021 | 158 | 164 | 151 |
| 28.12.2021 | 137 | 164 | 124 |
| 27.12.2021 | 127 | 130 | 125 |
| 26.12.2021 | 135 | 143 | 130 |
| 25.12.2021 | 132 | 145 | 116 |
© Bayerisches Landesamt für Umwelt 2025