
- Startseite >
- Flüsse >
- Wasserstand >
- Bayern >
- Wertheim >
- Jahresgrafik

Jahresgrafik Wertheim / Main
Wasserstand vom 01.01.2020 bis zum 31.12.2020
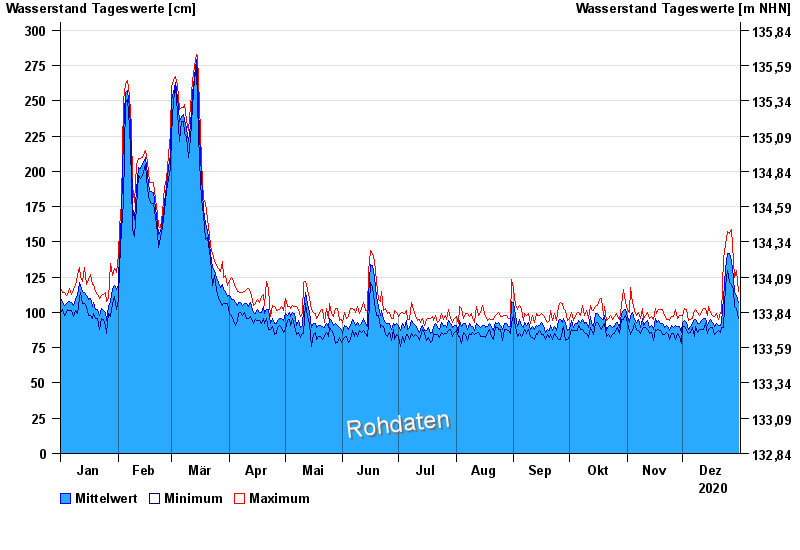
| Datum | Mittelwert [cm] | Maximum [cm] | Minimum [cm] |
|---|---|---|---|
| 31.12.2020 | 107 | 115 | 96 |
| 30.12.2020 | 112 | 130 | 103 |
| 29.12.2020 | 114 | 125 | 104 |
| 28.12.2020 | 125 | 136 | 116 |
| 27.12.2020 | 137 | 159 | 120 |
| 26.12.2020 | 142 | 156 | 121 |
| 25.12.2020 | 142 | 157 | 130 |
© Bayerisches Landesamt für Umwelt 2024