
- Startseite >
- Flüsse >
- Wasserstand >
- Oberer Main - Elbe >
- Fahrenbühl >
- Jahresgrafik

Jahresgrafik Fahrenbühl / Lamitz
Wasserstand vom 01.01.2022 bis zum 31.12.2022
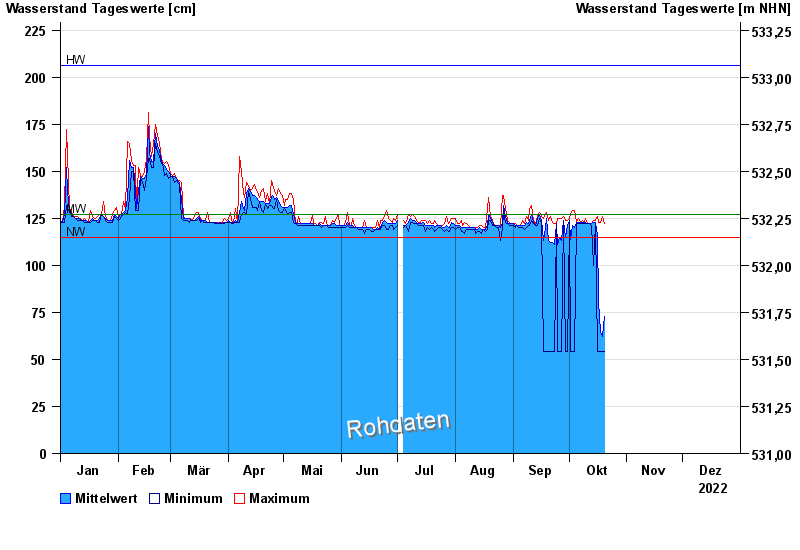
| Datum | Mittelwert [cm] | Maximum [cm] | Minimum [cm] |
|---|---|---|---|
| 20.10.2022 | 73 | 122 | 54 |
| 19.10.2022 | 62 | 126 | 54 |
| 18.10.2022 | 65 | 123 | 54 |
| 17.10.2022 | 81 | 123 | 54 |
| 16.10.2022 | 116 | 126 | 54 |
| 15.10.2022 | 123 | 124 | 122 |
| 14.10.2022 | 123 | 124 | 100 |
© Bayerisches Landesamt für Umwelt 2025