
- Startseite >
- Flüsse >
- Wasserstand >
- Oberer Main - Elbe >
- Hollfeld >
- Jahresgrafik

Jahresgrafik Hollfeld / Wiesent
Wasserstand vom 03.12.2019 bis zum 02.12.2020
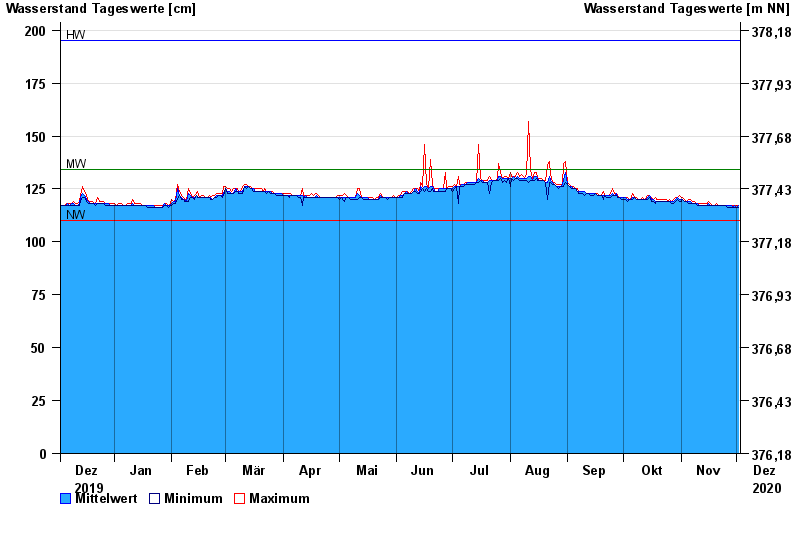
| Datum | Mittelwert [cm] | Maximum [cm] | Minimum [cm] |
|---|---|---|---|
| 02.12.2020 | 117 | 117 | 116 |
| 01.12.2020 | 116 | 117 | 116 |
| 30.11.2020 | 117 | 117 | 116 |
| 29.11.2020 | 116 | 117 | 116 |
| 28.11.2020 | 117 | 117 | 116 |
| 27.11.2020 | 117 | 117 | 116 |
| 26.11.2020 | 117 | 117 | 116 |
© Bayerisches Landesamt für Umwelt 2024