
- Startseite >
- Flüsse >
- Wasserstand >
- Oberer Main - Elbe >
- Laufermühle >
- Jahresgrafik

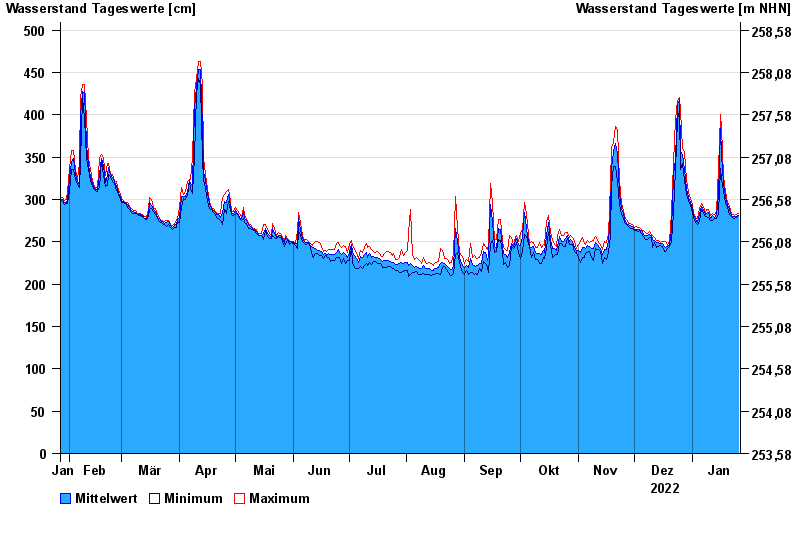
Jahresgrafik Laufermühle / Aisch
Wasserstand vom 27.01.2022 bis zum 26.01.2023
| Datum | Mittelwert [cm] | Maximum [cm] | Minimum [cm] |
|---|---|---|---|
| 26.01.2023 | 281 | 283 | 281 |
| 25.01.2023 | 280 | 282 | 279 |
| 24.01.2023 | 280 | 281 | 278 |
| 23.01.2023 | 280 | 282 | 278 |
| 22.01.2023 | 281 | 283 | 280 |
| 21.01.2023 | 288 | 292 | 282 |
| 20.01.2023 | 293 | 297 | 291 |
© Bayerisches Landesamt für Umwelt 2025