
- Startseite >
- Flüsse >
- Wasserstand >
- Oberer Main - Elbe >
- Oberlauter >
- Jahresgrafik

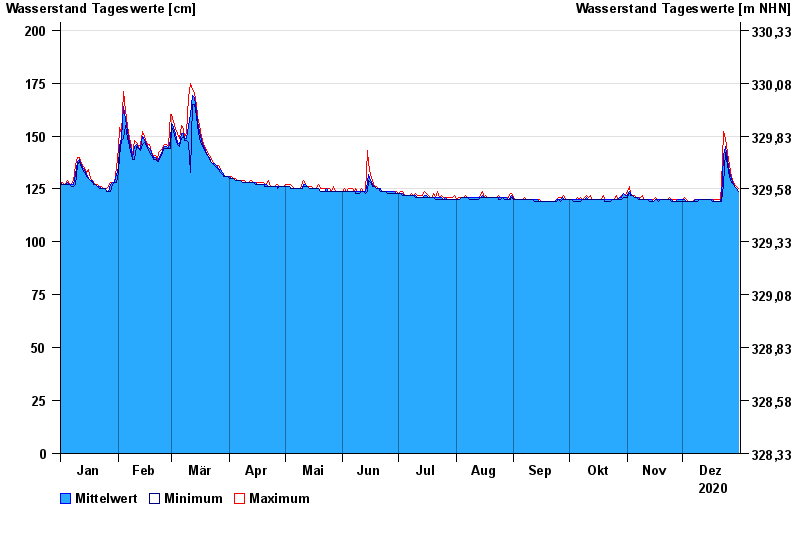
Jahresgrafik Oberlauter / Lauterbach
Wasserstand vom 01.01.2020 bis zum 31.12.2020
- 02.01.2003 Wasserstand: 248 cm
- 12.02.2005 Wasserstand: 244 cm
- 13.01.2011 Wasserstand: 229 cm
- 06.01.1982 Wasserstand: 228 cm
- 27.01.2002 Wasserstand: 227 cm
| Datum | Mittelwert [cm] | Maximum [cm] | Minimum [cm] |
|---|---|---|---|
| 31.12.2020 | 124 | 125 | 124 |
| 30.12.2020 | 125 | 126 | 125 |
| 29.12.2020 | 126 | 127 | 126 |
| 28.12.2020 | 127 | 128 | 127 |
| 27.12.2020 | 130 | 131 | 128 |
| 26.12.2020 | 133 | 136 | 131 |
| 25.12.2020 | 139 | 142 | 136 |
© Bayerisches Landesamt für Umwelt 2025