
- Startseite >
- Flüsse >
- Wasserstand >
- Oberer Main - Elbe >
- Schenkenau >
- Jahresgrafik

Jahresgrafik Schenkenau / Itz
Wasserstand vom 01.01.2020 bis zum 31.12.2020
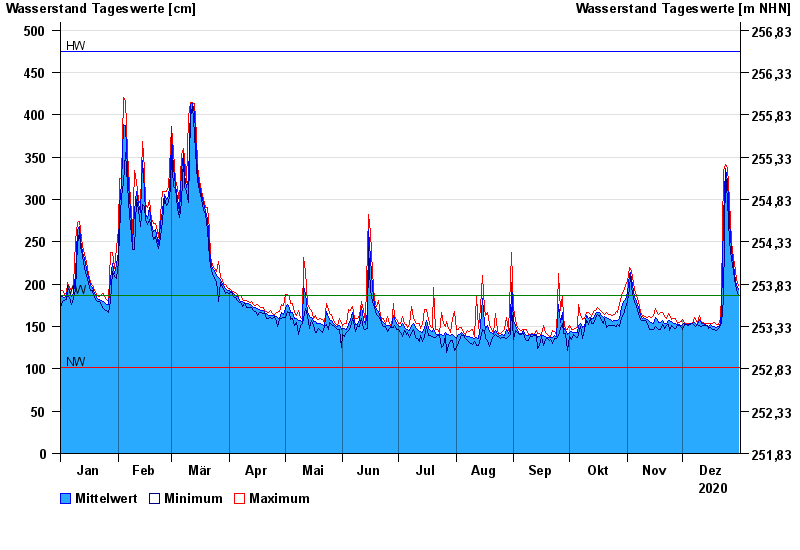
| Datum | Mittelwert [cm] | Maximum [cm] | Minimum [cm] |
|---|---|---|---|
| 31.12.2020 | 194 | 199 | 187 |
| 30.12.2020 | 198 | 206 | 194 |
| 29.12.2020 | 212 | 224 | 206 |
| 28.12.2020 | 223 | 230 | 216 |
| 27.12.2020 | 240 | 251 | 229 |
| 26.12.2020 | 274 | 299 | 250 |
| 25.12.2020 | 321 | 338 | 299 |
© Bayerisches Landesamt für Umwelt 2025