
- Startseite >
- Flüsse >
- Wasserstand >
- Oberer Main - Elbe >
- Schlehenmühle >
- Jahresgrafik

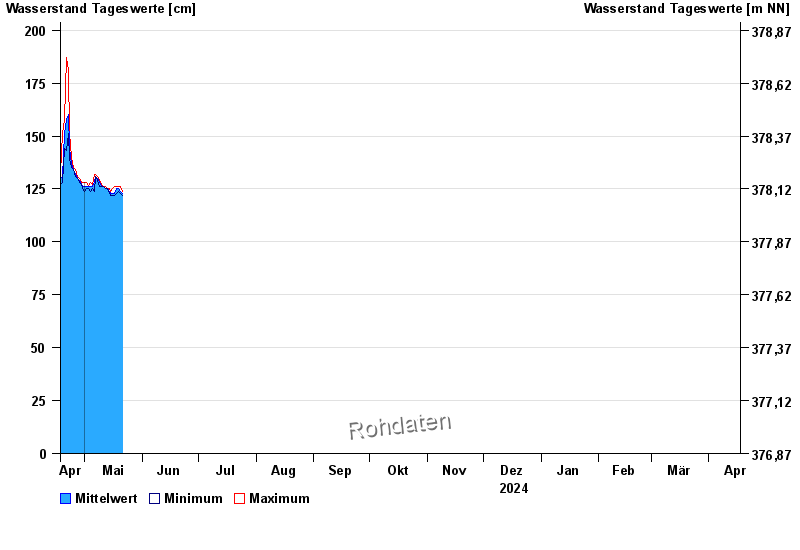
Jahresgrafik Schlehenmühle / Roter Main
Wasserstand vom 18.04.2024 bis zum 17.04.2025
 Für diesen Pegel sind keine Meldestufen hinterlegt.
| Datum | Mittelwert [cm] | Maximum [cm] | Minimum [cm] |
|---|---|---|---|
| 17.07.2024 | 122 | 123 | 121 |
| 16.07.2024 | 122 | 123 | 122 |
| 15.07.2024 | 124 | 126 | 122 |
| 14.07.2024 | 127 | 131 | 124 |
| 13.07.2024 | 138 | 154 | 126 |
| 12.07.2024 | 125 | 128 | 123 |
| 11.07.2024 | 124 | 128 | 121 |
© Bayerisches Landesamt für Umwelt 2024