
- Startseite >
- Flüsse >
- Wasserstand >
- Iller - Lech - Bodensee >
- Achsheim >
- Jahresgrafik

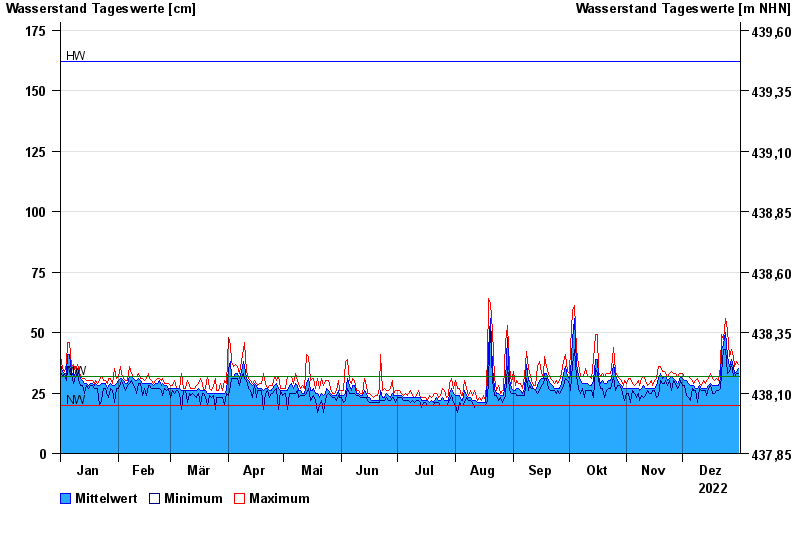
Jahresgrafik Achsheim / Schmutter
Wasserstand vom 01.01.2022 bis zum 31.12.2022
| Datum | Mittelwert [cm] | Maximum [cm] | Minimum [cm] |
|---|---|---|---|
| 31.12.2022 | 35 | 37 | 33 |
| 30.12.2022 | 34 | 38 | 33 |
| 29.12.2022 | 33 | 36 | 32 |
| 28.12.2022 | 36 | 40 | 32 |
| 27.12.2022 | 39 | 43 | 37 |
| 26.12.2022 | 36 | 40 | 34 |
| 25.12.2022 | 40 | 51 | 33 |
© Bayerisches Landesamt für Umwelt 2025