
- Startseite >
- Flüsse >
- Wasserstand >
- Iller - Lech - Bodensee >
- Biessenhofen >
- Jahresgrafik

Jahresgrafik Biessenhofen / Wertach
Wasserstand vom 01.10.2020 bis zum 30.09.2021
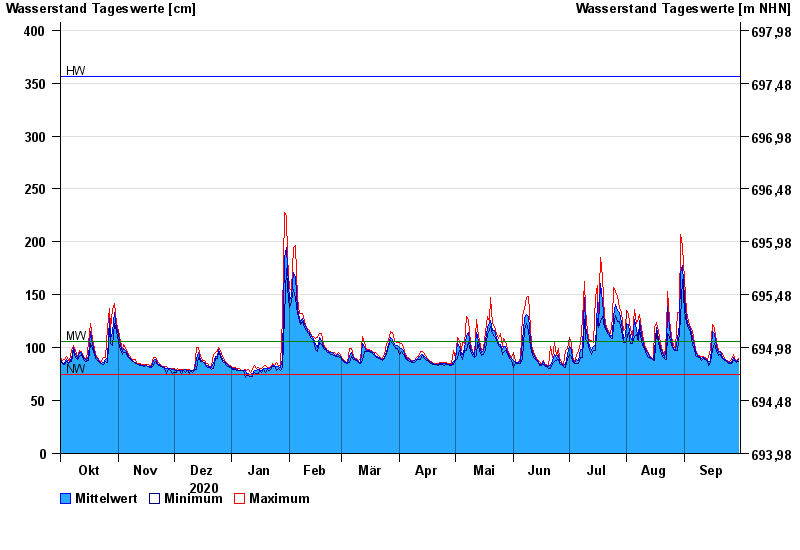
| Datum | Mittelwert [cm] | Maximum [cm] | Minimum [cm] |
|---|---|---|---|
| 30.09.2021 | 89 | 90 | 87 |
| 29.09.2021 | 87 | 88 | 86 |
| 28.09.2021 | 89 | 90 | 88 |
| 27.09.2021 | 91 | 94 | 88 |
| 26.09.2021 | 86 | 89 | 85 |
| 25.09.2021 | 86 | 87 | 85 |
| 24.09.2021 | 87 | 88 | 86 |
© Bayerisches Landesamt für Umwelt 2024