
- Startseite >
- Flüsse >
- Wasserstand >
- Iller - Lech - Bodensee >
- Fallmühle >
- Jahresgrafik

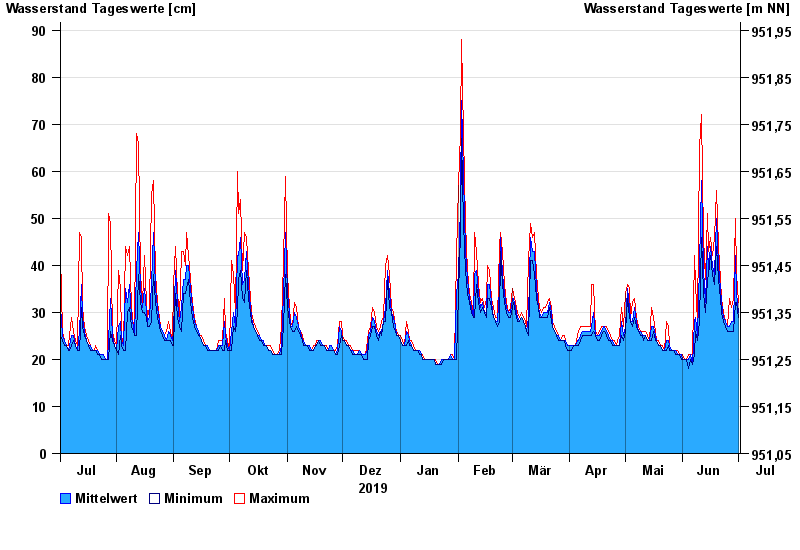
Jahresgrafik Fallmühle / Steinacher Achen
Wasserstand vom 02.07.2019 bis zum 01.07.2020
| Datum | Mittelwert [cm] | Maximum [cm] | Minimum [cm] |
|---|---|---|---|
| 01.07.2020 | 30 | 32 | 29 |
| 30.06.2020 | 34 | 38 | 32 |
| 29.06.2020 | 42 | 50 | 32 |
| 28.06.2020 | 28 | 33 | 26 |
| 27.06.2020 | 28 | 31 | 26 |
| 26.06.2020 | 27 | 33 | 26 |
| 25.06.2020 | 27 | 27 | 26 |
© Bayerisches Landesamt für Umwelt 2024