
- Startseite >
- Flüsse >
- Wasserstand >
- Iller - Lech - Bodensee >
- Oberaudorf >
- Jahresgrafik

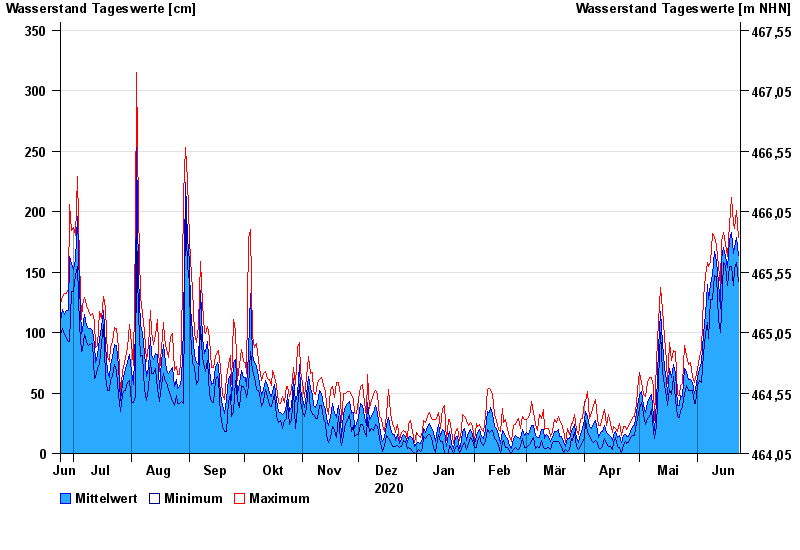
Jahresgrafik Oberaudorf / Inn
Wasserstand vom 24.06.2020 bis zum 23.06.2021
| Datum | Mittelwert [cm] | Maximum [cm] | Minimum [cm] |
|---|---|---|---|
| 23.06.2021 | 164 | 179 | 142 |
| 22.06.2021 | 179 | 201 | 158 |
| 21.06.2021 | 170 | 186 | 153 |
| 20.06.2021 | 165 | 190 | 139 |
| 19.06.2021 | 183 | 212 | 155 |
| 18.06.2021 | 176 | 189 | 155 |
| 17.06.2021 | 154 | 163 | 139 |
© Bayerisches Landesamt für Umwelt 2024