
- Startseite >
- Flüsse >
- Wasserstand >
- Iller - Lech - Bodensee >
- Oberaudorf >
- Jahresgrafik

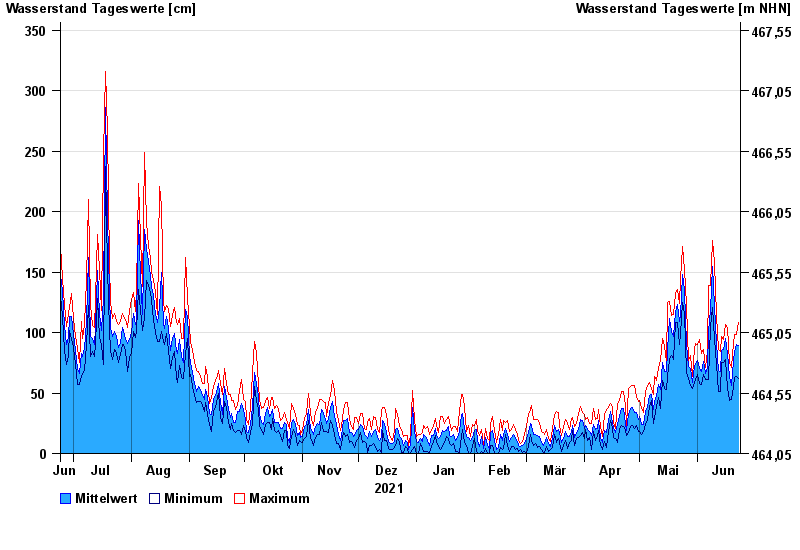
Jahresgrafik Oberaudorf / Inn
Wasserstand vom 24.06.2021 bis zum 23.06.2022
| Datum | Mittelwert [cm] | Maximum [cm] | Minimum [cm] |
|---|---|---|---|
| 23.06.2022 | 89 | 108 | 62 |
| 22.06.2022 | 90 | 98 | 64 |
| 21.06.2022 | 84 | 98 | 63 |
| 20.06.2022 | 77 | 91 | 55 |
| 19.06.2022 | 56 | 71 | 45 |
| 18.06.2022 | 63 | 75 | 44 |
| 17.06.2022 | 83 | 104 | 54 |
© Bayerisches Landesamt für Umwelt 2024