
- Startseite >
- Flüsse >
- Wasserstand >
- Inn >
- Bad Aibling >
- Jahresgrafik

Jahresgrafik Bad Aibling / Triftbach linker Mühlkanal
Wasserstand vom 29.03.2024 bis zum 28.03.2025
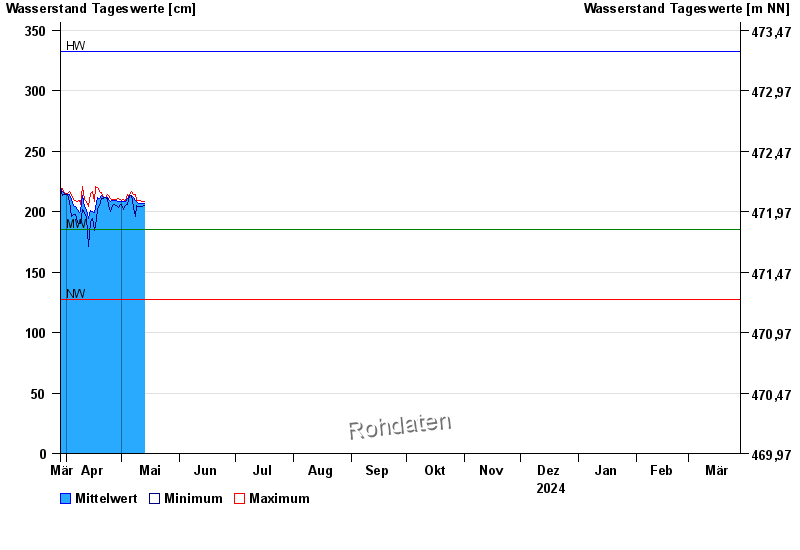
| Datum | Mittelwert [cm] | Maximum [cm] | Minimum [cm] |
|---|---|---|---|
| 14.09.2024 | 215 | 229 | 207 |
| 13.09.2024 | 205 | 208 | 202 |
| 12.09.2024 | 204 | 207 | 200 |
| 11.09.2024 | 203 | 205 | 199 |
| 10.09.2024 | 203 | 206 | 202 |
| 09.09.2024 | 203 | 207 | 196 |
| 08.09.2024 | 195 | 200 | 191 |
© Bayerisches Landesamt für Umwelt 2024