
- Startseite >
- Flüsse >
- Wasserstand >
- Inn >
- Burghausen >
- Jahresgrafik

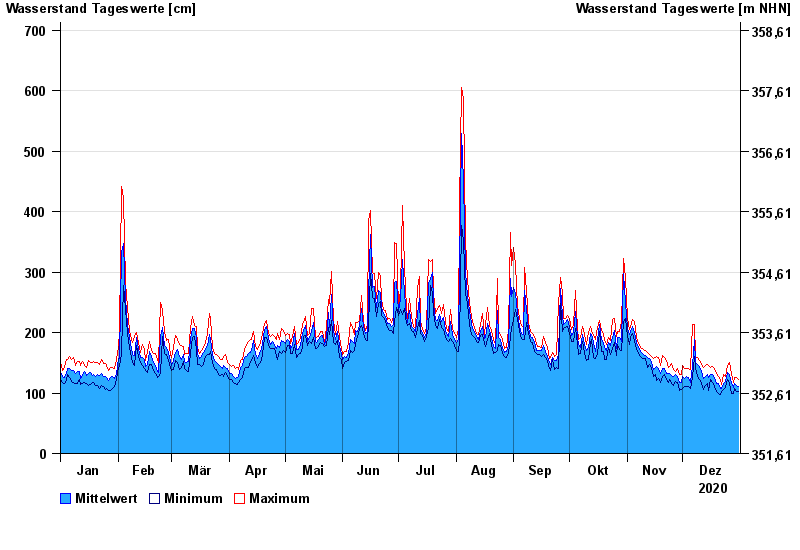
Jahresgrafik Burghausen / Salzach
Wasserstand vom 01.01.2020 bis zum 31.12.2020
- 14.09.1899 Wasserstand: 928 cm
- 08.09.1920 Wasserstand: 910 cm
- 03.06.2013 Wasserstand: 894 cm
- 14.08.1959 Wasserstand: 814 cm
- 13.08.2002 Wasserstand: 810 cm
| Datum | Mittelwert [cm] | Maximum [cm] | Minimum [cm] |
|---|---|---|---|
| 31.12.2020 | 110 | 123 | 102 |
| 30.12.2020 | 112 | 126 | 103 |
| 29.12.2020 | 116 | 126 | 108 |
| 28.12.2020 | 109 | 117 | 99 |
| 27.12.2020 | 116 | 131 | 100 |
| 26.12.2020 | 130 | 151 | 115 |
| 25.12.2020 | 134 | 145 | 122 |
© Bayerisches Landesamt für Umwelt 2025