
- Startseite >
- Flüsse >
- Wasserstand >
- Inn >
- Freising >
- Jahresgrafik

Jahresgrafik Freising / Isar
Wasserstand vom 01.01.2023 bis zum 31.12.2023
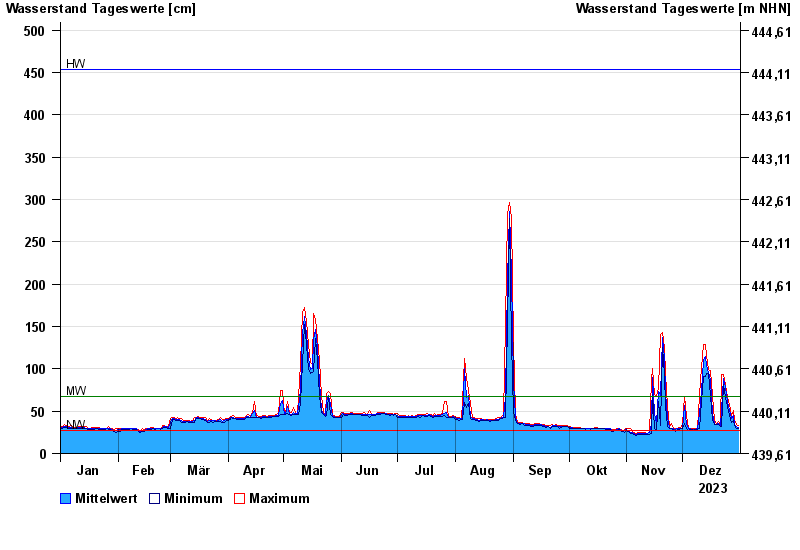
| Datum | Mittelwert [cm] | Maximum [cm] | Minimum [cm] |
|---|---|---|---|
| 31.12.2023 | 31 | 33 | 30 |
| 30.12.2023 | 32 | 34 | 30 |
| 29.12.2023 | 34 | 39 | 33 |
| 28.12.2023 | 45 | 51 | 39 |
| 27.12.2023 | 41 | 45 | 37 |
| 26.12.2023 | 51 | 58 | 45 |
| 25.12.2023 | 61 | 66 | 56 |
© Bayerisches Landesamt für Umwelt 2025