
- Startseite >
- Flüsse >
- Wasserstand >
- Inn >
- Hochberg >
- Jahresgrafik

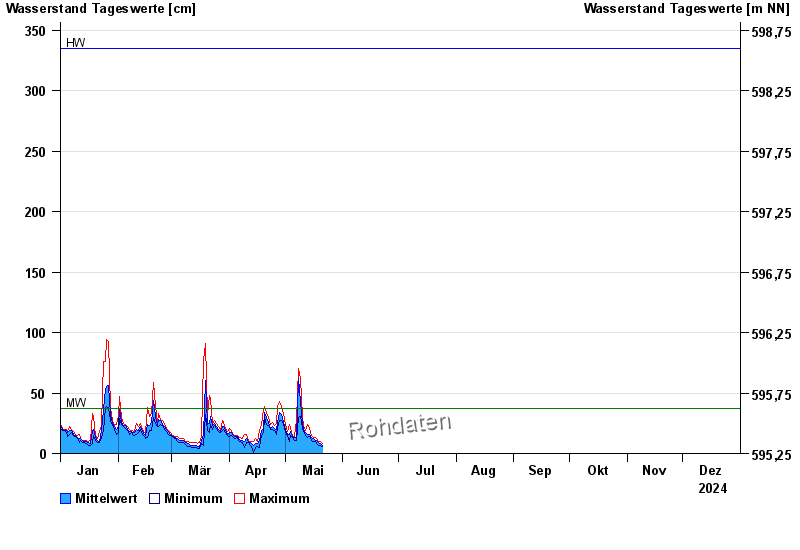
Jahresgrafik Hochberg / Traun
Wasserstand vom 01.01.2024 bis zum 31.12.2024
| Datum | Mittelwert [cm] | Maximum [cm] | Minimum [cm] |
|---|---|---|---|
| 12.07.2024 | 6 | 7 | 6 |
| 11.07.2024 | 9 | 16 | 6 |
| 10.07.2024 | 8 | 22 | 4 |
| 09.07.2024 | 6 | 8 | 4 |
| 08.07.2024 | 8 | 11 | 6 |
| 07.07.2024 | 10 | 13 | 7 |
| 06.07.2024 | 7 | 8 | 6 |
© Bayerisches Landesamt für Umwelt 2024