
- Startseite >
- Flüsse >
- Wasserstand >
- Inn >
- Mühldorf >
- Jahresgrafik

Jahresgrafik Mühldorf / Inn
Wasserstand vom 22.10.2020 bis zum 21.10.2021
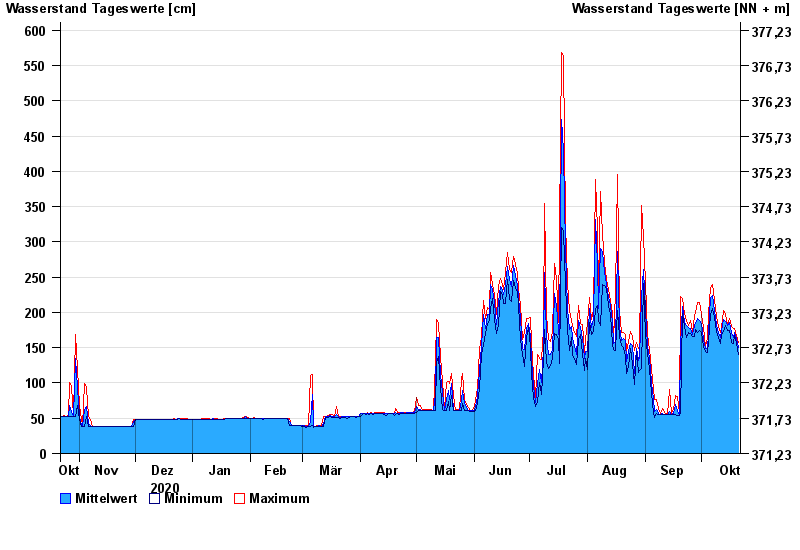
- 410 cm: Mühldorf: Einstellung des Betriebs der Innfähre
| Datum | Mittelwert [cm] | Maximum [cm] | Minimum [cm] |
|---|---|---|---|
| 21.10.2021 | 150 | 157 | 141 |
| 20.10.2021 | 163 | 167 | 156 |
| 19.10.2021 | 171 | 177 | 167 |
| 18.10.2021 | 164 | 177 | 156 |
| 17.10.2021 | 171 | 180 | 157 |
| 16.10.2021 | 185 | 192 | 174 |
| 15.10.2021 | 181 | 183 | 175 |
© Bayerisches Landesamt für Umwelt 2025