
- Startseite >
- Flüsse >
- Wasserstand >
- Inn >
- Stein bei Altenmarkt >
- Jahresgrafik

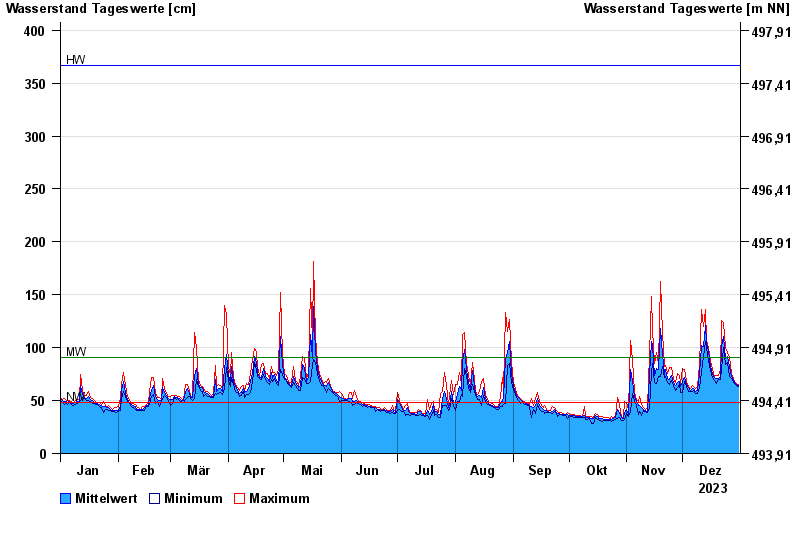
Jahresgrafik Stein bei Altenmarkt / Traun
Wasserstand vom 01.01.2023 bis zum 31.12.2023
| Datum | Mittelwert [cm] | Maximum [cm] | Minimum [cm] |
|---|---|---|---|
| 31.12.2023 | 64 | 65 | 63 |
| 30.12.2023 | 65 | 66 | 64 |
| 29.12.2023 | 67 | 68 | 66 |
| 28.12.2023 | 69 | 71 | 67 |
| 27.12.2023 | 73 | 76 | 71 |
| 26.12.2023 | 82 | 91 | 73 |
| 25.12.2023 | 92 | 95 | 86 |
© Bayerisches Landesamt für Umwelt 2024