
- Startseite >
- Flüsse >
- Wasserstand >
- Inn >
- Unterjettenberg >
- Jahresgrafik

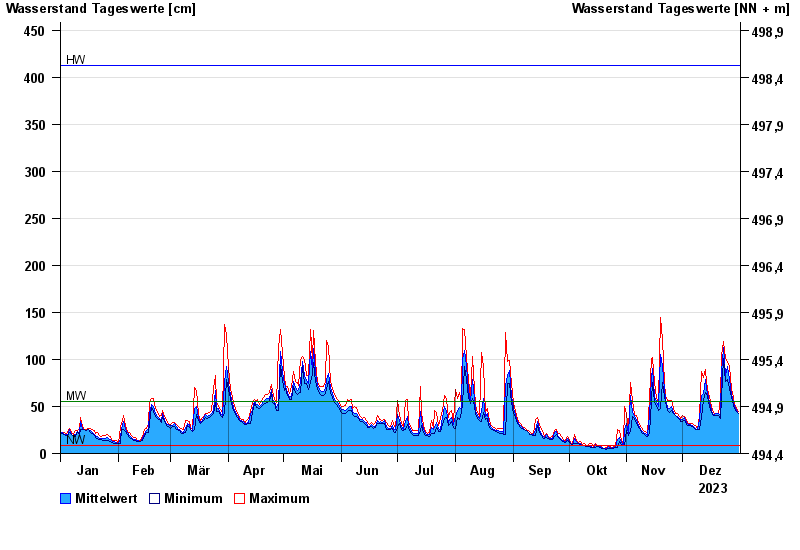
Jahresgrafik Unterjettenberg / Saalach
Wasserstand vom 01.01.2023 bis zum 31.12.2023
| Datum | Mittelwert [cm] | Maximum [cm] | Minimum [cm] |
|---|---|---|---|
| 31.12.2023 | 43 | 45 | 42 |
| 30.12.2023 | 46 | 48 | 45 |
| 29.12.2023 | 50 | 52 | 48 |
| 28.12.2023 | 54 | 60 | 51 |
| 27.12.2023 | 63 | 69 | 60 |
| 26.12.2023 | 79 | 93 | 69 |
| 25.12.2023 | 92 | 97 | 79 |
© Bayerisches Landesamt für Umwelt 2025