
- Startseite >
- Flüsse >
- Wasserstand >
- Isar >
- Bad Aibling >
- Jahresgrafik

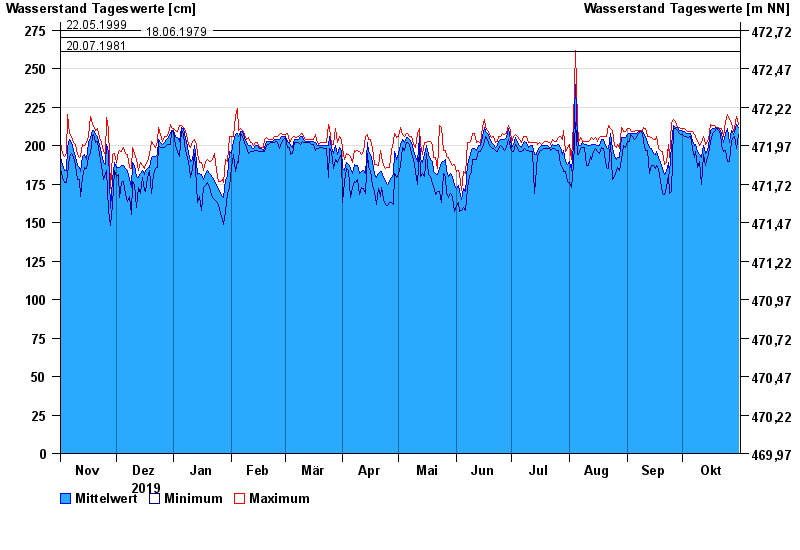
Jahresgrafik Bad Aibling / Triftbach linker Mühlkanal
Wasserstand vom 01.11.2019 bis zum 31.10.2020
- 02.06.2013 Wasserstand: 332 cm
- 10.08.1970 Wasserstand: 280 cm
- 22.05.1999 Wasserstand: 275 cm
- 18.06.1979 Wasserstand: 270 cm
- 20.07.1981 Wasserstand: 261 cm
| Datum | Mittelwert [cm] | Maximum [cm] | Minimum [cm] |
|---|---|---|---|
| 31.10.2020 | 212 | 214 | 207 |
| 30.10.2020 | 214 | 219 | 198 |
| 29.10.2020 | 209 | 211 | 206 |
| 28.10.2020 | 207 | 209 | 205 |
| 27.10.2020 | 210 | 215 | 203 |
| 26.10.2020 | 202 | 217 | 190 |
| 25.10.2020 | 211 | 220 | 190 |
© Bayerisches Landesamt für Umwelt 2024