
- Startseite >
- Flüsse >
- Wasserstand >
- Isar >
- Bad Aibling >
- Jahresgrafik

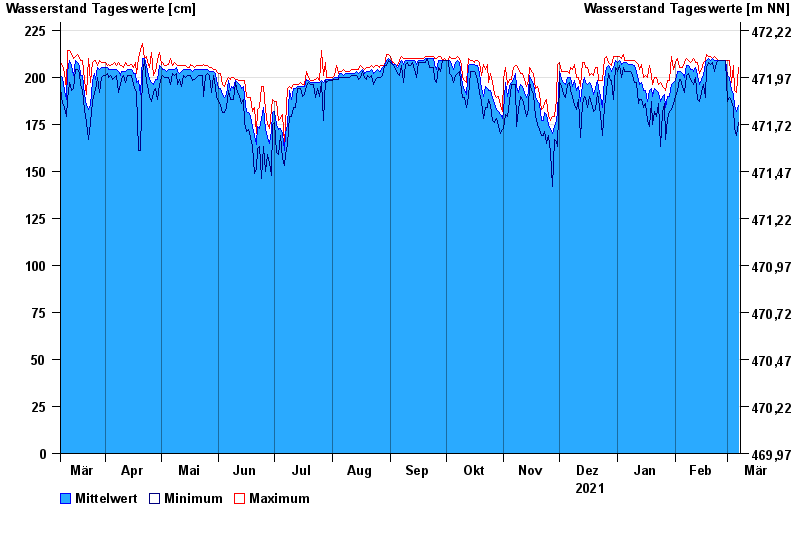
Jahresgrafik Bad Aibling / Triftbach linker Mühlkanal
Wasserstand vom 08.03.2021 bis zum 07.03.2022
- 02.06.2013 Wasserstand: 332 cm
- 10.08.1970 Wasserstand: 280 cm
- 22.05.1999 Wasserstand: 275 cm
- 18.06.1979 Wasserstand: 270 cm
- 20.07.1981 Wasserstand: 261 cm
| Datum | Mittelwert [cm] | Maximum [cm] | Minimum [cm] |
|---|---|---|---|
| 07.03.2022 | 185 | 205 | 176 |
| 06.03.2022 | 182 | 192 | 169 |
| 05.03.2022 | 185 | 193 | 173 |
| 04.03.2022 | 191 | 206 | 184 |
| 03.03.2022 | 193 | 197 | 187 |
| 02.03.2022 | 200 | 209 | 189 |
| 01.03.2022 | 201 | 209 | 187 |
© Bayerisches Landesamt für Umwelt 2024