
- Startseite >
- Flüsse >
- Wasserstand >
- Isar >
- Bad Aibling Willinger Brücke >
- Jahresgrafik

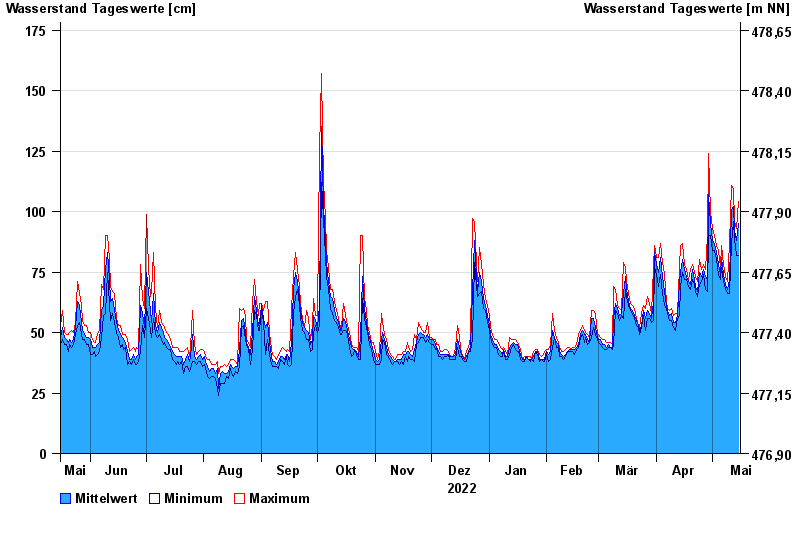
Jahresgrafik Bad Aibling Willinger Brücke / Mangfall
Wasserstand vom 16.05.2022 bis zum 15.05.2023
- Wasserstand: cm
- Wasserstand: cm
- Wasserstand: cm
- Wasserstand: cm
- Wasserstand: cm
| Datum | Mittelwert [cm] | Maximum [cm] | Minimum [cm] |
|---|---|---|---|
| 15.05.2023 | 95 | 104 | 82 |
| 14.05.2023 | 88 | 93 | 82 |
| 13.05.2023 | 92 | 96 | 89 |
| 12.05.2023 | 102 | 109 | 96 |
| 11.05.2023 | 101 | 111 | 87 |
| 10.05.2023 | 72 | 87 | 66 |
| 09.05.2023 | 68 | 71 | 66 |
© Bayerisches Landesamt für Umwelt 2024