
- Startseite >
- Flüsse >
- Wasserstand >
- Isar >
- Beuerberg >
- Jahresgrafik

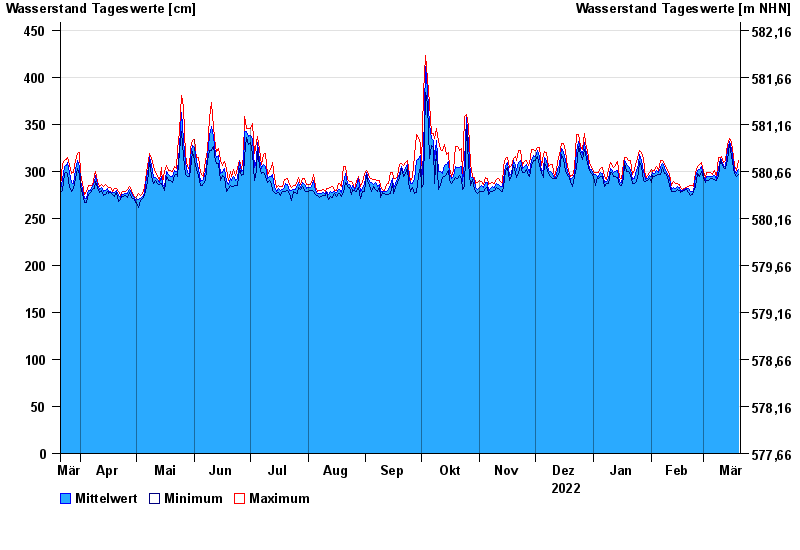
Jahresgrafik Beuerberg / Loisach
Wasserstand vom 21.03.2022 bis zum 20.03.2023
- 24.05.1999 Wasserstand: 572 cm
- 23.08.2005 Wasserstand: 564 cm
- 03.06.2013 Wasserstand: 556 cm
- 18.06.1979 Wasserstand: 556 cm
- 04.08.2020 Wasserstand: 532 cm
| Datum | Mittelwert [cm] | Maximum [cm] | Minimum [cm] |
|---|---|---|---|
| 20.03.2023 | 302 | 312 | 297 |
| 19.03.2023 | 298 | 301 | 295 |
| 18.03.2023 | 301 | 305 | 298 |
| 17.03.2023 | 309 | 316 | 303 |
| 16.03.2023 | 324 | 331 | 316 |
| 15.03.2023 | 332 | 335 | 329 |
| 14.03.2023 | 322 | 329 | 312 |
© Bayerisches Landesamt für Umwelt 2024