
- Startseite >
- Flüsse >
- Wasserstand >
- Isar >
- Großschwindau >
- Jahresgrafik

Jahresgrafik Großschwindau / Goldach
Wasserstand vom 01.01.2023 bis zum 31.12.2023
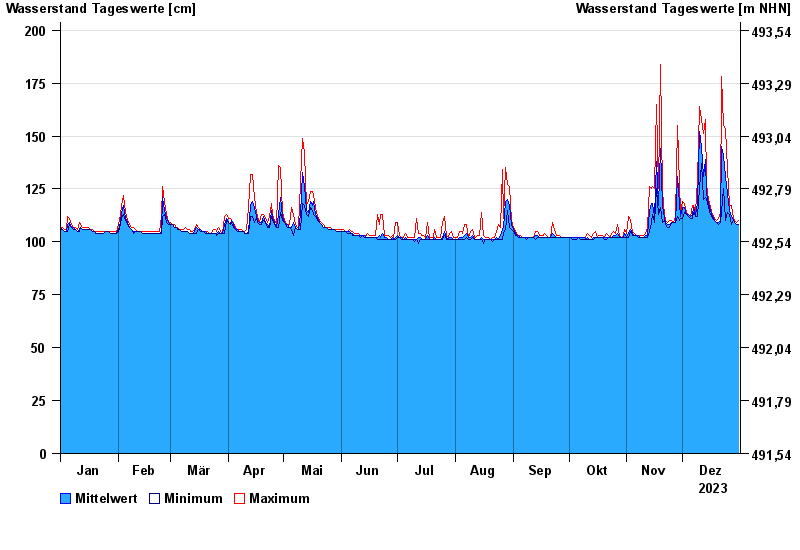
- 350 cm: Großschwindau: zu erwartender Pegelstand bei hundertjährlichem Hochwasser
| Datum | Mittelwert [cm] | Maximum [cm] | Minimum [cm] |
|---|---|---|---|
| 31.12.2023 | 108 | 110 | 108 |
| 30.12.2023 | 108 | 109 | 108 |
| 29.12.2023 | 109 | 110 | 109 |
| 28.12.2023 | 110 | 111 | 110 |
| 27.12.2023 | 112 | 117 | 108 |
| 26.12.2023 | 115 | 117 | 113 |
| 25.12.2023 | 123 | 134 | 114 |
© Bayerisches Landesamt für Umwelt 2025