
- Startseite >
- Flüsse >
- Wasserstand >
- Isar >
- Hechendorf >
- Jahresgrafik

Jahresgrafik Hechendorf / Ramsach
Wasserstand vom 01.01.2023 bis zum 31.12.2023
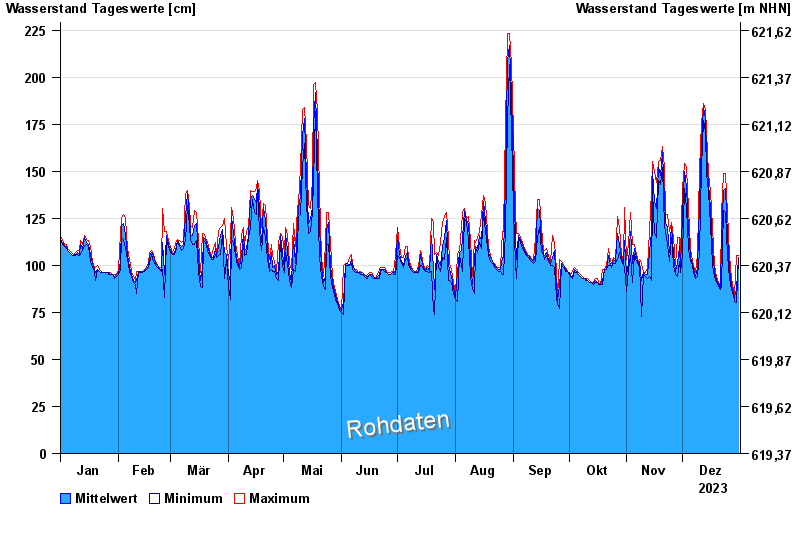
Hinweis
Messwerte beeinflusst durch Kraftwerkssteuerung.
| Datum | Mittelwert [cm] | Maximum [cm] | Minimum [cm] |
|---|---|---|---|
| 31.12.2023 | 104 | 105 | 104 |
| 30.12.2023 | 87 | 105 | 80 |
| 29.12.2023 | 83 | 84 | 81 |
| 28.12.2023 | 85 | 87 | 84 |
| 27.12.2023 | 90 | 93 | 87 |
| 26.12.2023 | 98 | 105 | 93 |
| 25.12.2023 | 115 | 128 | 105 |
© Bayerisches Landesamt für Umwelt 2025