
- Startseite >
- Flüsse >
- Wasserstand >
- Isar >
- Landshut Flutmulde >
- Jahresgrafik

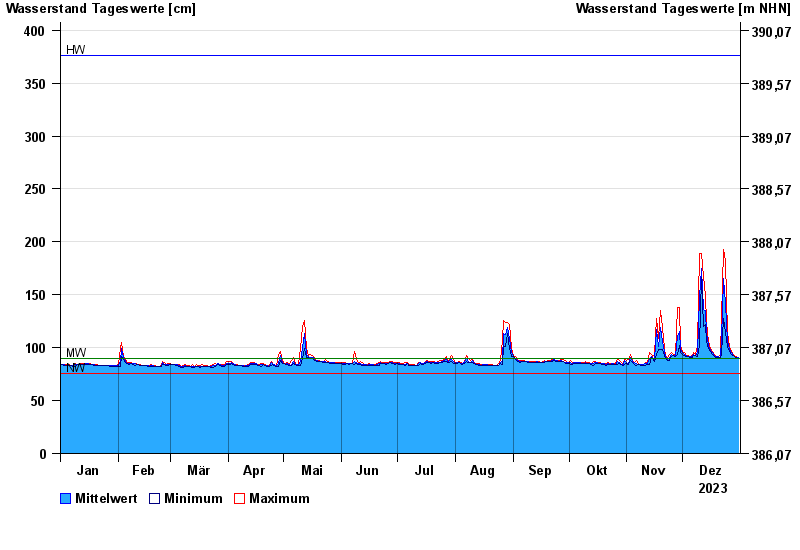
Jahresgrafik Landshut Flutmulde / Isar
Wasserstand vom 01.01.2023 bis zum 31.12.2023
| Datum | Mittelwert [cm] | Maximum [cm] | Minimum [cm] |
|---|---|---|---|
| 31.12.2023 | 91 | 91 | 90 |
| 30.12.2023 | 91 | 92 | 91 |
| 29.12.2023 | 92 | 93 | 92 |
| 28.12.2023 | 93 | 94 | 93 |
| 27.12.2023 | 95 | 96 | 94 |
| 26.12.2023 | 98 | 101 | 96 |
| 25.12.2023 | 106 | 114 | 101 |
© Bayerisches Landesamt für Umwelt 2025