
- Startseite >
- Flüsse >
- Wasserstand >
- Isar >
- Oberhausen >
- Jahresgrafik

Jahresgrafik Oberhausen / Ach
Wasserstand vom 21.05.2022 bis zum 20.05.2023
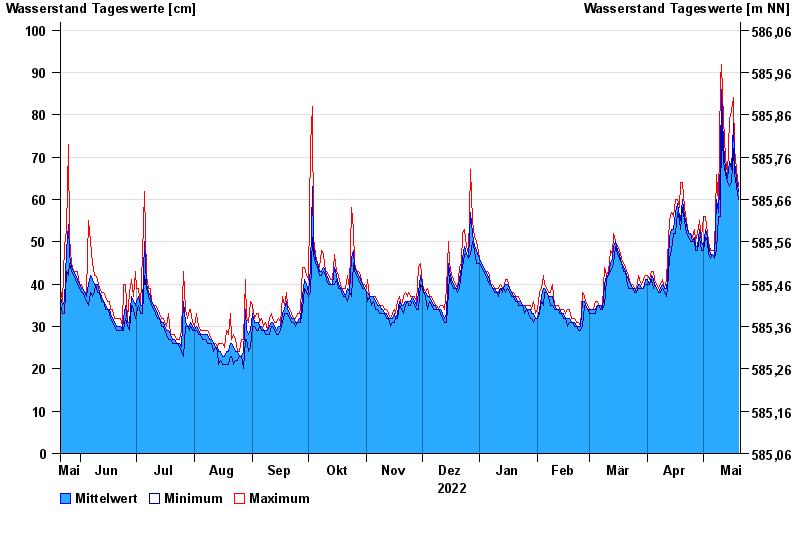
- Hochwassergefahrenfläche HQ100 236 cm
| Datum | Mittelwert [cm] | Maximum [cm] | Minimum [cm] |
|---|---|---|---|
| 20.05.2023 | 62 | 63 | 60 |
| 19.05.2023 | 65 | 67 | 63 |
| 18.05.2023 | 69 | 72 | 66 |
| 17.05.2023 | 78 | 84 | 72 |
| 16.05.2023 | 67 | 81 | 64 |
| 15.05.2023 | 69 | 79 | 63 |
| 14.05.2023 | 65 | 66 | 64 |
© Bayerisches Landesamt für Umwelt 2024