
- Startseite >
- Flüsse >
- Wasserstand >
- Isar >
- Oberhausen >
- Jahresgrafik

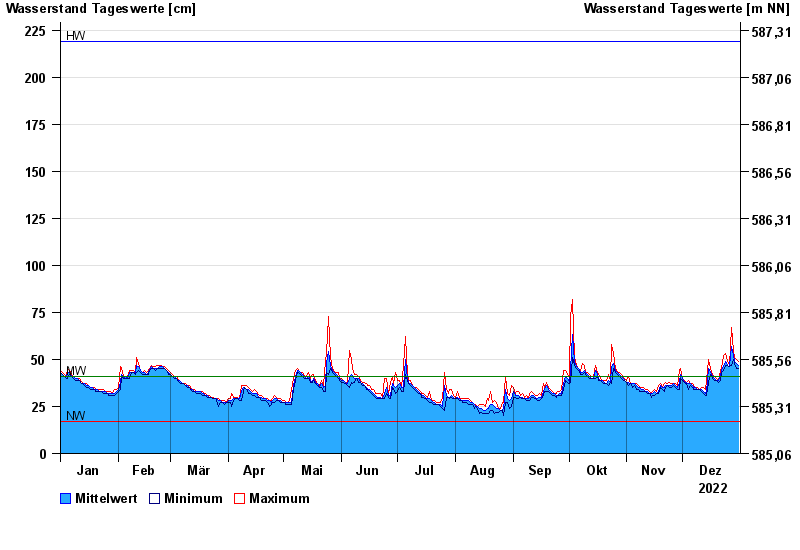
Jahresgrafik Oberhausen / Ach
Wasserstand vom 01.01.2022 bis zum 31.12.2022
| Datum | Mittelwert [cm] | Maximum [cm] | Minimum [cm] |
|---|---|---|---|
| 31.12.2022 | 47 | 49 | 45 |
| 30.12.2022 | 48 | 50 | 45 |
| 29.12.2022 | 49 | 51 | 48 |
| 28.12.2022 | 52 | 55 | 50 |
| 27.12.2022 | 57 | 67 | 47 |
| 26.12.2022 | 46 | 47 | 46 |
| 25.12.2022 | 47 | 49 | 47 |
© Bayerisches Landesamt für Umwelt 2025