
- Startseite >
- Flüsse >
- Wasserstand >
- Isar >
- Raisting >
- Jahresgrafik

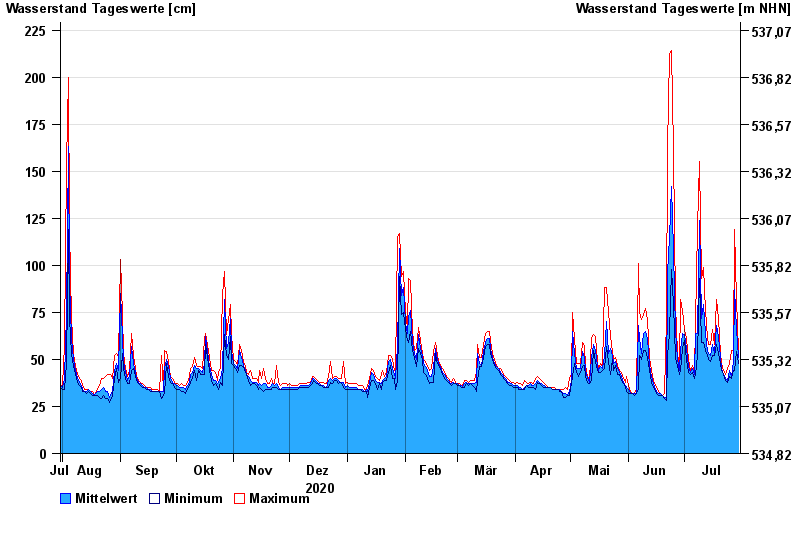
Jahresgrafik Raisting / Rott
Wasserstand vom 31.07.2020 bis zum 30.07.2021
Hinweis
Messwerte beeinflusst durch Kraftwerkssteuerung.
| Datum | Mittelwert [cm] | Maximum [cm] | Minimum [cm] |
|---|---|---|---|
| 30.07.2021 | 51 | 54 | 48 |
| 29.07.2021 | 66 | 82 | 54 |
| 28.07.2021 | 87 | 119 | 44 |
| 27.07.2021 | 49 | 55 | 44 |
| 26.07.2021 | 41 | 55 | 40 |
| 25.07.2021 | 44 | 48 | 41 |
| 24.07.2021 | 39 | 45 | 38 |
© Bayerisches Landesamt für Umwelt 2025