
- Startseite >
- Flüsse >
- Wasserstand >
- Isar >
- Rosenheim o.d. Mangfallmündung >
- Monatsgrafik

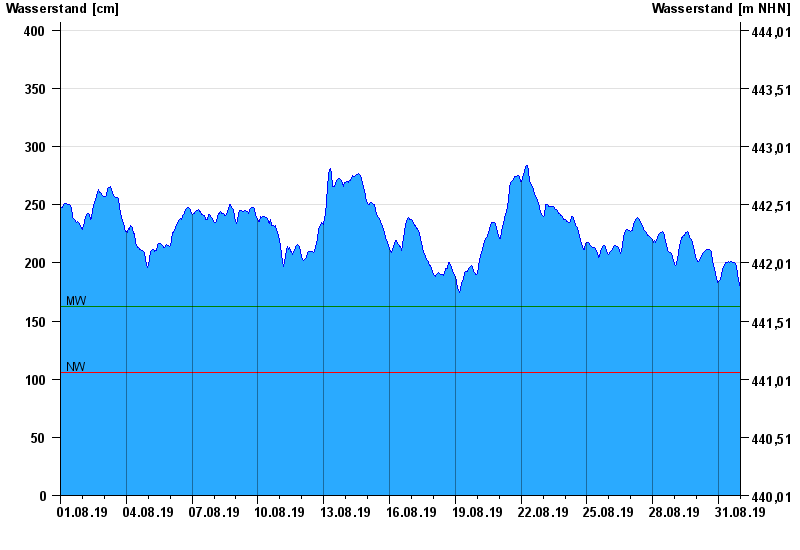
Monatsgrafik Rosenheim o.d. Mangfallmündung / Inn
Wasserstand vom 01.08.2019 bis zum 31.08.2019
| Datum | Wasserstand [cm] |
|---|---|
| 01.09.2019 00:45 | 179 |
| 01.09.2019 00:30 | 179 |
| 01.09.2019 00:15 | 179 |
| 01.09.2019 00:00 | 179 |
| 31.08.2019 23:45 | 180 |
| 31.08.2019 23:30 | 181 |
| 31.08.2019 23:15 | 181 |
© Bayerisches Landesamt für Umwelt 2024