
- Startseite >
- Flüsse >
- Wasserstand >
- Isar >
- Rottach >
- Jahresgrafik

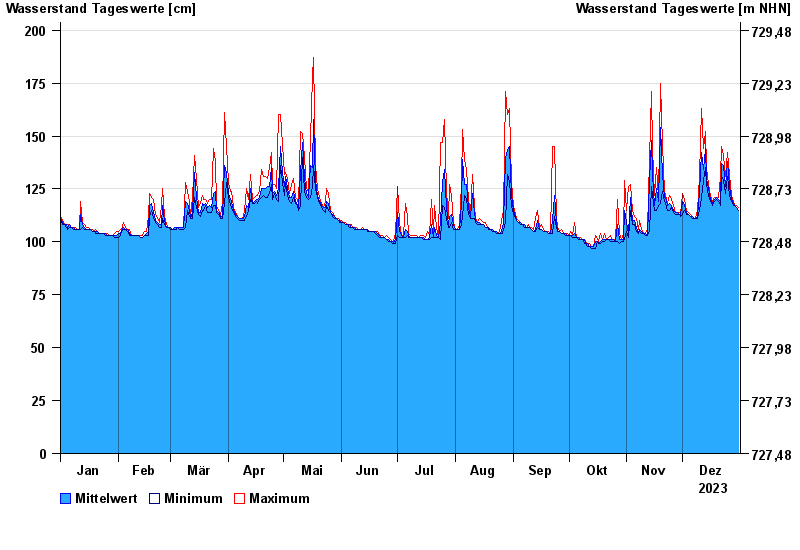
Jahresgrafik Rottach / Rottach
Wasserstand vom 01.01.2023 bis zum 31.12.2023
- Hochwassergefahrenfläche HQ100 270 cm
| Datum | Mittelwert [cm] | Maximum [cm] | Minimum [cm] |
|---|---|---|---|
| 31.12.2023 | 115 | 116 | 115 |
| 30.12.2023 | 116 | 117 | 116 |
| 29.12.2023 | 117 | 117 | 117 |
| 28.12.2023 | 118 | 119 | 117 |
| 27.12.2023 | 120 | 122 | 119 |
| 26.12.2023 | 126 | 132 | 122 |
| 25.12.2023 | 138 | 142 | 131 |
© Bayerisches Landesamt für Umwelt 2025