
- Startseite >
- Flüsse >
- Wasserstand >
- Isar >
- Schmerold >
- Jahresgrafik

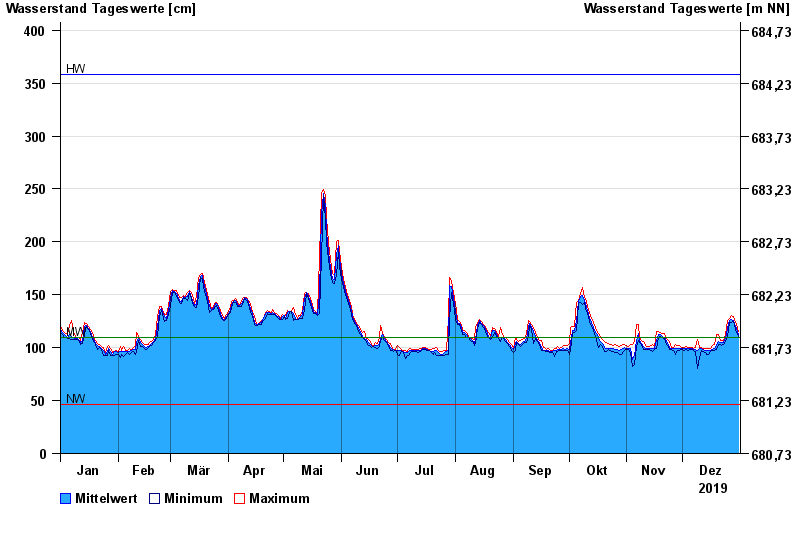
Jahresgrafik Schmerold / Mangfall
Wasserstand vom 01.01.2019 bis zum 31.12.2019
| Datum | Mittelwert [cm] | Maximum [cm] | Minimum [cm] |
|---|---|---|---|
| 31.12.2019 | 112 | 115 | 111 |
| 30.12.2019 | 118 | 122 | 114 |
| 29.12.2019 | 123 | 126 | 121 |
| 28.12.2019 | 126 | 129 | 125 |
| 27.12.2019 | 127 | 130 | 124 |
| 26.12.2019 | 126 | 128 | 124 |
| 25.12.2019 | 118 | 126 | 111 |
© Bayerisches Landesamt für Umwelt 2025