
- Startseite >
- Flüsse >
- Wasserstand >
- Obere Donau >
- Ansbach >
- Jahresgrafik

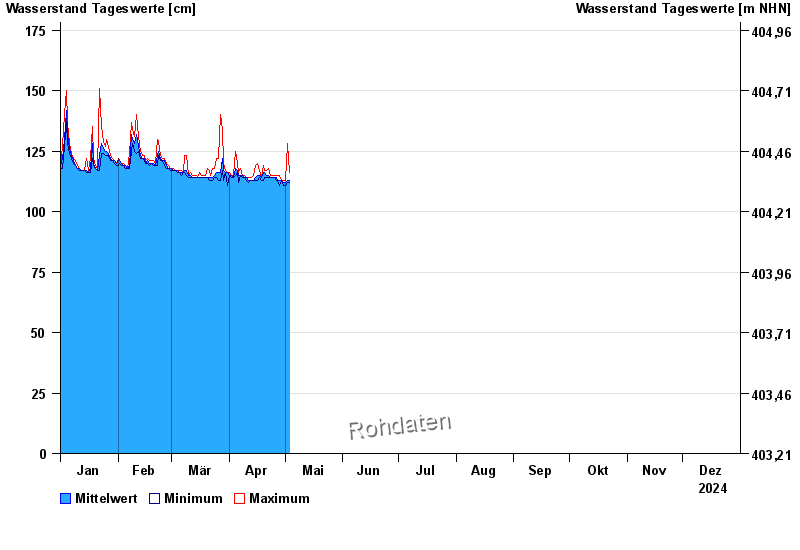
Jahresgrafik Ansbach / Hennenbach
Wasserstand vom 01.01.2024 bis zum 31.12.2024
 Für diesen Pegel sind keine historische Ereignisse hinterlegt.
| Datum | Mittelwert [cm] | Maximum [cm] | Minimum [cm] |
|---|---|---|---|
| 26.12.2024 | 111 | 111 | 110 |
| 25.12.2024 | 111 | 111 | 110 |
| 24.12.2024 | 111 | 111 | 111 |
| 23.12.2024 | 111 | 112 | 111 |
| 22.12.2024 | 112 | 112 | 111 |
| 21.12.2024 | 111 | 111 | 110 |
| 20.12.2024 | 111 | 112 | 111 |
© Bayerisches Landesamt für Umwelt 2024