
- Startseite >
- Flüsse >
- Wasserstand >
- Obere Donau >
- Bockenfeld >
- Jahresgrafik

Jahresgrafik Bockenfeld / Tauber
Wasserstand vom 01.01.2023 bis zum 31.12.2023
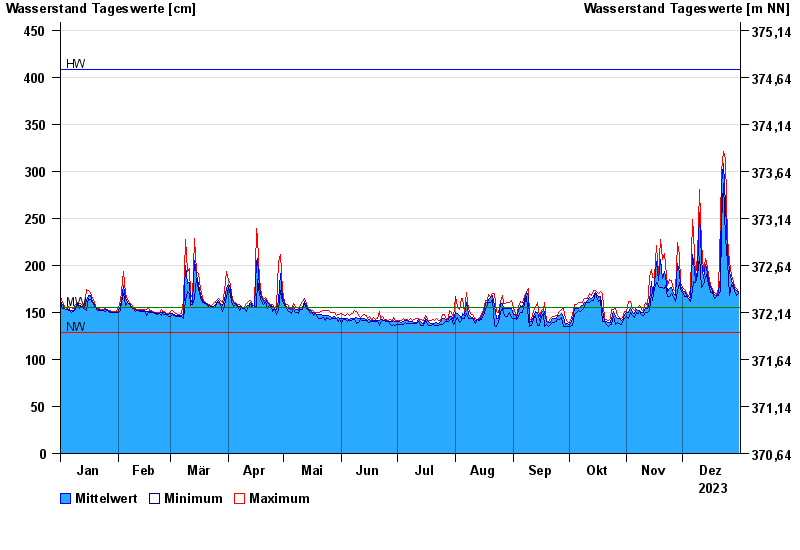
Hinweis
Wasserstand und Abfluss wird zeitweise durch Biberdamm beeinflusst.
| Datum | Mittelwert [cm] | Maximum [cm] | Minimum [cm] |
|---|---|---|---|
| 31.12.2023 | 171 | 172 | 170 |
| 30.12.2023 | 173 | 175 | 168 |
| 29.12.2023 | 175 | 178 | 172 |
| 28.12.2023 | 179 | 183 | 176 |
| 27.12.2023 | 184 | 189 | 180 |
| 26.12.2023 | 194 | 204 | 168 |
| 25.12.2023 | 215 | 229 | 204 |
© Bayerisches Landesamt für Umwelt 2025