
- Startseite >
- Flüsse >
- Wasserstand >
- Obere Donau >
- Deuerling >
- Jahresgrafik

Jahresgrafik Deuerling / Schwarze Laber
Wasserstand vom 01.01.2019 bis zum 31.12.2019
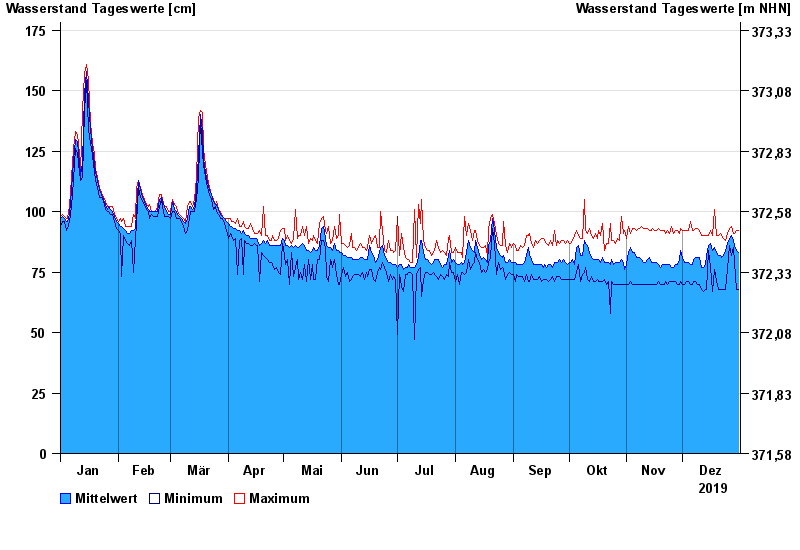
| Datum | Mittelwert [cm] | Maximum [cm] | Minimum [cm] |
|---|---|---|---|
| 31.12.2019 | 83 | 92 | 68 |
| 30.12.2019 | 84 | 92 | 68 |
| 29.12.2019 | 86 | 91 | 79 |
| 28.12.2019 | 88 | 91 | 85 |
| 27.12.2019 | 90 | 94 | 82 |
| 26.12.2019 | 89 | 93 | 86 |
| 25.12.2019 | 87 | 91 | 76 |
© Bayerisches Landesamt für Umwelt 2025