
- Startseite >
- Flüsse >
- Wasserstand >
- Obere Donau >
- Hasberg >
- Jahresgrafik

Jahresgrafik Hasberg / Östliche Mindel
Wasserstand vom 19.09.2022 bis zum 18.09.2023
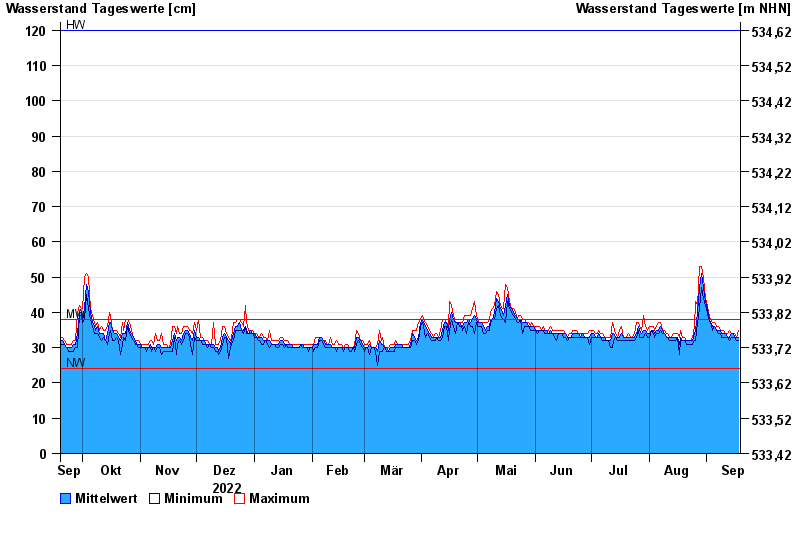
| Datum | Mittelwert [cm] | Maximum [cm] | Minimum [cm] |
|---|---|---|---|
| 18.09.2023 | 33 | 35 | 32 |
| 17.09.2023 | 33 | 33 | 32 |
| 16.09.2023 | 33 | 34 | 33 |
| 15.09.2023 | 34 | 34 | 33 |
| 14.09.2023 | 34 | 34 | 33 |
| 13.09.2023 | 33 | 35 | 32 |
| 12.09.2023 | 33 | 34 | 33 |
© Bayerisches Landesamt für Umwelt 2024