
- Startseite >
- Flüsse >
- Wasserstand >
- Obere Donau >
- Kelheim >
- Jahresgrafik

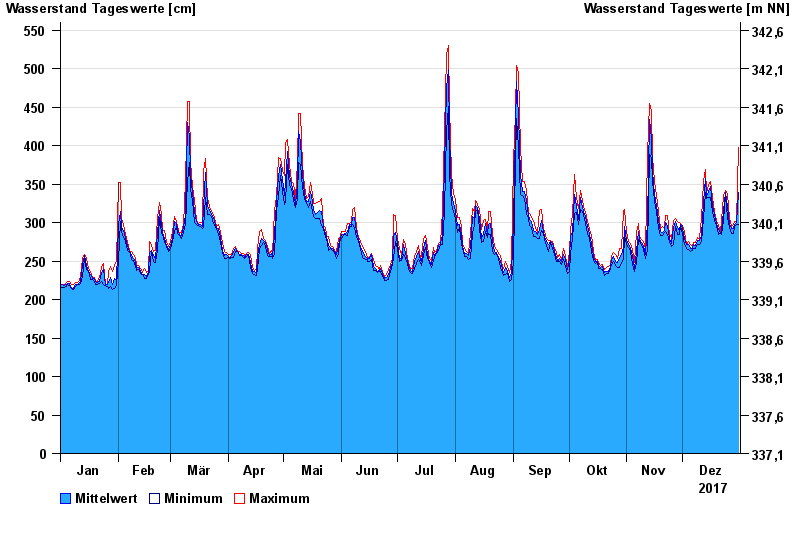
Jahresgrafik Kelheim / Donau
Wasserstand vom 01.01.2017 bis zum 31.12.2017
- 24.05.1999 Wasserstand: 796 cm
- 25.08.2005 Wasserstand: 729 cm
- 13.06.1965 Wasserstand: 725 cm
- 04.06.2013 Wasserstand: 716 cm
- 14.08.2002 Wasserstand: 699 cm
| Datum | Mittelwert [cm] | Maximum [cm] | Minimum [cm] |
|---|---|---|---|
| 31.12.2017 | 339 | 397 | 298 |
| 30.12.2017 | 300 | 302 | 298 |
| 29.12.2017 | 297 | 301 | 295 |
| 28.12.2017 | 292 | 297 | 286 |
| 27.12.2017 | 292 | 295 | 286 |
| 26.12.2017 | 298 | 307 | 293 |
| 25.12.2017 | 321 | 337 | 307 |
© Bayerisches Landesamt für Umwelt 2025