
- Startseite >
- Flüsse >
- Wasserstand >
- Obere Donau >
- Lentersdorf >
- Jahresgrafik

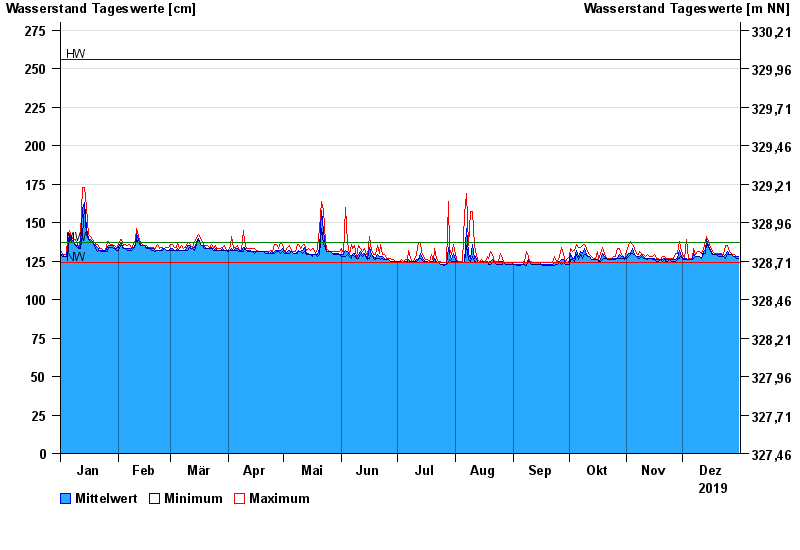
Jahresgrafik Lentersdorf / Bibert
Wasserstand vom 01.01.2019 bis zum 31.12.2019
| Datum | Mittelwert [cm] | Maximum [cm] | Minimum [cm] |
|---|---|---|---|
| 31.12.2019 | 128 | 128 | 127 |
| 30.12.2019 | 128 | 128 | 127 |
| 29.12.2019 | 128 | 129 | 128 |
| 28.12.2019 | 128 | 129 | 128 |
| 27.12.2019 | 129 | 130 | 129 |
| 26.12.2019 | 129 | 131 | 129 |
| 25.12.2019 | 131 | 135 | 129 |
© Bayerisches Landesamt für Umwelt 2025