
- Startseite >
- Flüsse >
- Wasserstand >
- Obere Donau >
- Neumühle >
- Jahresgrafik

Jahresgrafik Neumühle / Rednitz
Wasserstand vom 01.01.2019 bis zum 31.12.2019
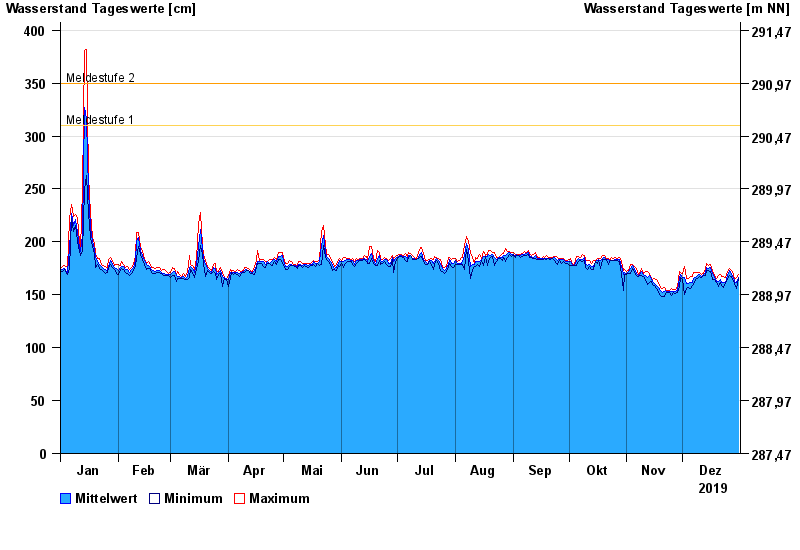
- Meldestufe 1 310 cm
- Meldestufe 2 350 cm
- Meldestufe 3 420 cm
- Meldestufe 4 470 cm
| Datum | Mittelwert [cm] | Maximum [cm] | Minimum [cm] |
|---|---|---|---|
| 31.12.2019 | 166 | 169 | 165 |
| 30.12.2019 | 162 | 166 | 156 |
| 29.12.2019 | 163 | 164 | 161 |
| 28.12.2019 | 166 | 169 | 163 |
| 27.12.2019 | 169 | 173 | 167 |
| 26.12.2019 | 173 | 175 | 168 |
| 25.12.2019 | 168 | 172 | 164 |
© Bayerisches Landesamt für Umwelt 2025