
- Startseite >
- Flüsse >
- Wasserstand >
- Obere Donau >
- Oberding >
- Jahresgrafik

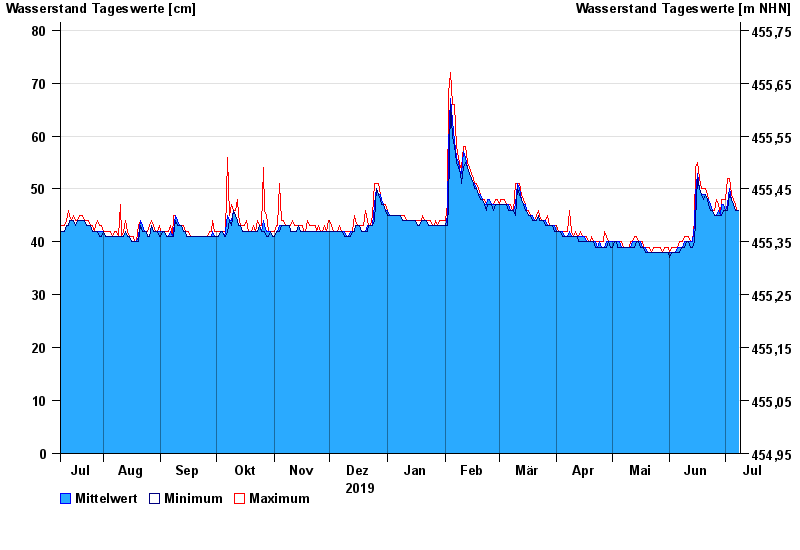
Jahresgrafik Oberding / Gfällach
Wasserstand vom 09.07.2019 bis zum 08.07.2020
- 03.06.2013 Wasserstand: 121 cm
- 18.07.1974 Wasserstand: 120 cm
- 07.06.1995 Wasserstand: 116 cm
- 31.07.1977 Wasserstand: 114 cm
- 08.08.1978 Wasserstand: 113 cm
| Datum | Mittelwert [cm] | Maximum [cm] | Minimum [cm] |
|---|---|---|---|
| 08.07.2020 | 46 | 46 | 46 |
| 07.07.2020 | 46 | 46 | 46 |
| 06.07.2020 | 46 | 47 | 46 |
| 05.07.2020 | 47 | 48 | 47 |
| 04.07.2020 | 48 | 49 | 48 |
| 03.07.2020 | 50 | 52 | 49 |
| 02.07.2020 | 47 | 52 | 46 |
© Bayerisches Landesamt für Umwelt 2024